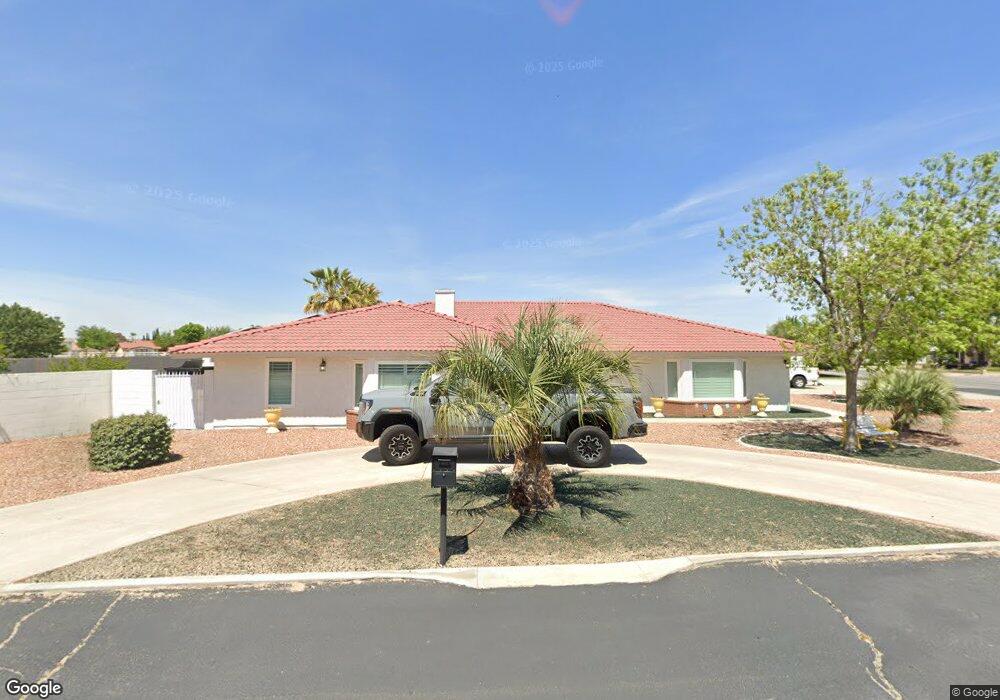
19010 Caballero Rd Apple Valley, CA 92308
High Desert NeighborhoodEstimated Value: $499,000 - $602,000
4
Beds
3
Baths
2,397
Sq Ft
$233/Sq Ft
Est. Value
About This Home
This home is located at 19010 Caballero Rd, Apple Valley, CA 92308 and is currently estimated at $558,987, approximately $233 per square foot. 19010 Caballero Rd is a home located in San Bernardino County with nearby schools including Rio Vista School of Applied Learning, Apple Valley High School, and Excelsior Charter School.
Ownership History
Date
Name
Owned For
Owner Type
Purchase Details
Closed on
Apr 11, 2024
Sold by
Williams Ryan and Williams Terri
Bought by
Ryan And Terri Williams Revocable Trust and Williams
Current Estimated Value
Purchase Details
Closed on
Jun 16, 1998
Sold by
Williams Joanne M
Bought by
Williams Ryan and Williams Terri
Home Financials for this Owner
Home Financials are based on the most recent Mortgage that was taken out on this home.
Original Mortgage
$132,600
Interest Rate
6.9%
Mortgage Type
VA
Purchase Details
Closed on
Oct 22, 1997
Sold by
Williams Joanne M
Bought by
Williams Joanne M
Home Financials for this Owner
Home Financials are based on the most recent Mortgage that was taken out on this home.
Original Mortgage
$33,000
Interest Rate
7.23%
Purchase Details
Closed on
Apr 18, 1994
Sold by
Williams Joanne M
Bought by
Williams Joanne M
Create a Home Valuation Report for This Property
The Home Valuation Report is an in-depth analysis detailing your home's value as well as a comparison with similar homes in the area
Home Values in the Area
Average Home Value in this Area
Purchase History
| Date | Buyer | Sale Price | Title Company |
|---|---|---|---|
| Ryan And Terri Williams Revocable Trust | -- | None Listed On Document | |
| Williams Ryan | $130,000 | Stewart Title | |
| Williams Joanne M | -- | Chicago Title Co | |
| Williams Joanne M | -- | -- |
Source: Public Records
Mortgage History
| Date | Status | Borrower | Loan Amount |
|---|---|---|---|
| Previous Owner | Williams Ryan | $132,600 | |
| Previous Owner | Williams Joanne M | $33,000 |
Source: Public Records
Tax History
| Year | Tax Paid | Tax Assessment Tax Assessment Total Assessment is a certain percentage of the fair market value that is determined by local assessors to be the total taxable value of land and additions on the property. | Land | Improvement |
|---|---|---|---|---|
| 2025 | $2,594 | $217,192 | $47,032 | $170,160 |
| 2024 | $2,448 | $212,934 | $46,110 | $166,824 |
| 2023 | $2,424 | $208,759 | $45,206 | $163,553 |
| 2022 | $2,386 | $204,666 | $44,320 | $160,346 |
| 2021 | $2,330 | $200,653 | $43,451 | $157,202 |
| 2020 | $2,301 | $198,595 | $43,005 | $155,590 |
| 2019 | $2,257 | $194,701 | $42,162 | $152,539 |
| 2018 | $2,071 | $179,115 | $41,334 | $137,781 |
| 2017 | $2,041 | $175,603 | $40,524 | $135,079 |
| 2016 | $1,947 | $172,159 | $39,729 | $132,430 |
| 2015 | $1,917 | $169,573 | $39,132 | $130,441 |
| 2014 | $1,890 | $166,251 | $38,365 | $127,886 |
Source: Public Records
Map
Nearby Homes
- 18965 Shetland Rd
- 12635 Sorrel Dr
- 12690 Mar Vista Dr
- 0 Town Center Dr
- 12720 Yorkshire Dr
- 19045 Elm Dr
- 19065 Elm Dr
- 1 Apple Valley Rd
- 11722 Oak St
- 0 Juniper Dr Unit CV25238237
- 0 Westmont Dr
- 11682 Maple St
- 11689 Ash St
- 18663 Arrowhead Trail
- 19269 Elm Dr
- 19333 Town Center
- 19228 Cottonwood Dr
- 19256 Cottonwood Dr
- 19242 Cottonwood Dr
- 12685 Pinehurst
- 19025 Pimlico Rd
- 19015 Caballero Rd
- 19015 Pimlico Rd
- 18990 Caballero Rd
- 19040 Pimlico Rd
- 19055 Pimlico Rd
- 19020 Pimlico Rd
- 18980 Caballero Rd
- 18995 Pimlico Rd
- 19010 Pimlico Rd
- 19010 Bay Meadows Dr
- 19065 Pimlico Rd
- 18970 Caballero Rd
- 19030 Bay Meadows Dr
- 19000 Pimlico Rd
- 18965 Pimlico Rd
- 19080 Pimlico Rd
- 19040 Bay Meadows Dr
- 19075 Pimlico Rd
- 18990 Pimlico Rd
Your Personal Tour Guide
Ask me questions while you tour the home.