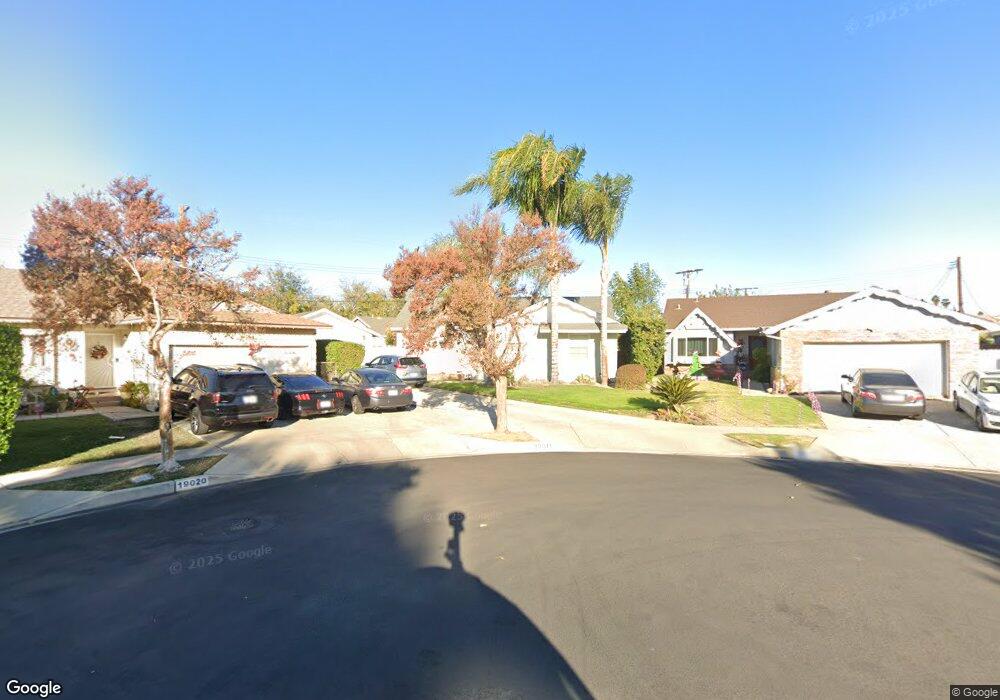
19011 Runnymede St Reseda, CA 91335
Estimated Value: $801,830 - $1,016,000
4
Beds
2
Baths
1,366
Sq Ft
$650/Sq Ft
Est. Value
About This Home
This home is located at 19011 Runnymede St, Reseda, CA 91335 and is currently estimated at $888,208, approximately $650 per square foot. 19011 Runnymede St is a home located in Los Angeles County with nearby schools including Reseda Elementary School, John A. Sutter Middle School, and Northridge Middle School.
Ownership History
Date
Name
Owned For
Owner Type
Purchase Details
Closed on
Nov 18, 2020
Sold by
Libecap Felissa I and Libecap Joanne F
Bought by
Felissa Libecap And Joanne Ziegler Revocable and Libecap
Current Estimated Value
Purchase Details
Closed on
Sep 6, 2018
Sold by
Libecap Felissa I
Bought by
Libecap Felissa I and Ziegler Joanne E
Home Financials for this Owner
Home Financials are based on the most recent Mortgage that was taken out on this home.
Original Mortgage
$395,417
Interest Rate
4.5%
Mortgage Type
New Conventional
Purchase Details
Closed on
Nov 20, 2008
Sold by
Garcia Domingo F
Bought by
Viscovich Penny and Libecap Felissa I
Home Financials for this Owner
Home Financials are based on the most recent Mortgage that was taken out on this home.
Original Mortgage
$268,800
Interest Rate
6.1%
Mortgage Type
Purchase Money Mortgage
Purchase Details
Closed on
May 22, 2006
Sold by
Gudino Maribel
Bought by
Garcia Domingo F
Home Financials for this Owner
Home Financials are based on the most recent Mortgage that was taken out on this home.
Original Mortgage
$450,400
Interest Rate
1.5%
Mortgage Type
Purchase Money Mortgage
Purchase Details
Closed on
May 9, 2006
Sold by
Yourshimi Edmond and Yourshimi Danial David
Bought by
Garcia Domingo F
Home Financials for this Owner
Home Financials are based on the most recent Mortgage that was taken out on this home.
Original Mortgage
$450,400
Interest Rate
1.5%
Mortgage Type
Purchase Money Mortgage
Purchase Details
Closed on
Jan 20, 2005
Sold by
Yourshlmi Edmond
Bought by
Yourshlmi Edmond and Yourshlmi Danial David
Home Financials for this Owner
Home Financials are based on the most recent Mortgage that was taken out on this home.
Original Mortgage
$348,000
Interest Rate
5.37%
Mortgage Type
Purchase Money Mortgage
Purchase Details
Closed on
Nov 22, 2004
Sold by
Chaney Edward D and Chaney Donna Sue
Bought by
Yourshlmi Edmond
Home Financials for this Owner
Home Financials are based on the most recent Mortgage that was taken out on this home.
Original Mortgage
$348,000
Interest Rate
5.37%
Mortgage Type
Purchase Money Mortgage
Purchase Details
Closed on
Jul 30, 1997
Sold by
Chaney Edward A and Chaney Paulette
Bought by
Chaney Edward D and Chaney Donna Sue
Purchase Details
Closed on
Dec 4, 1996
Sold by
Palys Joseph F Tr Joseph F Palys Trust
Bought by
Chaney Edward A and Chaney Paulette
Create a Home Valuation Report for This Property
The Home Valuation Report is an in-depth analysis detailing your home's value as well as a comparison with similar homes in the area
Home Values in the Area
Average Home Value in this Area
Purchase History
| Date | Buyer | Sale Price | Title Company |
|---|---|---|---|
| Felissa Libecap And Joanne Ziegler Revocable | -- | Hermance Crista B | |
| Libecap Felissa I | -- | North American Title Company | |
| Libecap Felissa I | -- | North American Title Company | |
| Viscovich Penny | $336,000 | Fidelity Van Nuys | |
| Garcia Domingo F | -- | United Independent Title Ins | |
| Garcia Domingo F | $563,000 | United Independent Title Ins | |
| Yourshlmi Edmond | -- | -- | |
| Yourshlmi Edmond | $435,000 | Fidelity National Financial | |
| Chaney Edward D | -- | -- | |
| Chaney Edward A | $69,000 | Gateway Title Company | |
| Chaney Edward A | $69,000 | Gateway Title Company |
Source: Public Records
Mortgage History
| Date | Status | Borrower | Loan Amount |
|---|---|---|---|
| Previous Owner | Libecap Felissa I | $395,417 | |
| Previous Owner | Viscovich Penny | $268,800 | |
| Previous Owner | Garcia Domingo F | $450,400 | |
| Previous Owner | Yourshlmi Edmond | $348,000 | |
| Closed | Yourshlmi Edmond | $87,000 |
Source: Public Records
Tax History Compared to Growth
Tax History
| Year | Tax Paid | Tax Assessment Tax Assessment Total Assessment is a certain percentage of the fair market value that is determined by local assessors to be the total taxable value of land and additions on the property. | Land | Improvement |
|---|---|---|---|---|
| 2025 | $6,335 | $520,306 | $306,390 | $213,916 |
| 2024 | $6,335 | $510,105 | $300,383 | $209,722 |
| 2023 | $6,214 | $500,104 | $294,494 | $205,610 |
| 2022 | $5,927 | $490,299 | $288,720 | $201,579 |
| 2021 | $5,850 | $480,686 | $283,059 | $197,627 |
| 2020 | $5,906 | $475,758 | $280,157 | $195,601 |
| 2019 | $5,676 | $466,430 | $274,664 | $191,766 |
| 2018 | $4,657 | $380,268 | $217,976 | $162,292 |
| 2017 | $4,553 | $372,812 | $213,702 | $159,110 |
| 2016 | $4,441 | $365,503 | $209,512 | $155,991 |
| 2015 | $4,376 | $360,013 | $206,365 | $153,648 |
| 2014 | $4,395 | $352,962 | $202,323 | $150,639 |
Source: Public Records
Map
Nearby Homes
- 7459 Vanalden Ave
- 7326 Vanalden Ave
- 7514 Beckford Ave
- 7518 Beckford Ave
- 7315 Ariel Ave
- 18844 Saticoy St
- 7645 Wilbur Ave
- 18800 Cohasset St
- 7650 Wilbur Ave
- 19009 Sherman Way Unit 22
- 19009 Sherman Way Unit 2
- 7300 Sylvia Ave
- 19103 Sherman Way
- 7527 Tampa Ave Unit 1
- 18725 Covello St
- 7319 Tampa Ave
- 18750 Keswick St
- 18958 Sherman Way Unit 17
- 18958 Sherman Way Unit 19
- 18656 Runnymede St
- 19007 Runnymede St
- 19020 Runnymede St
- 7438 Donna Ave
- 7432 Donna Ave
- 19001 Runnymede St
- 7444 Donna Ave
- 7426 Donna Ave
- 19016 Runnymede St
- 7445 Wystone Ave
- 7450 Donna Ave
- 7420 Donna Ave
- 19012 Runnymede St
- 7449 Wystone Ave
- 19008 Runnymede St
- 19000 Runnymede St
- 7454 Donna Ave
- 7414 Donna Ave
- 18958 Runnymede St
- 7455 Wystone Ave
- 7434 Wystone Ave