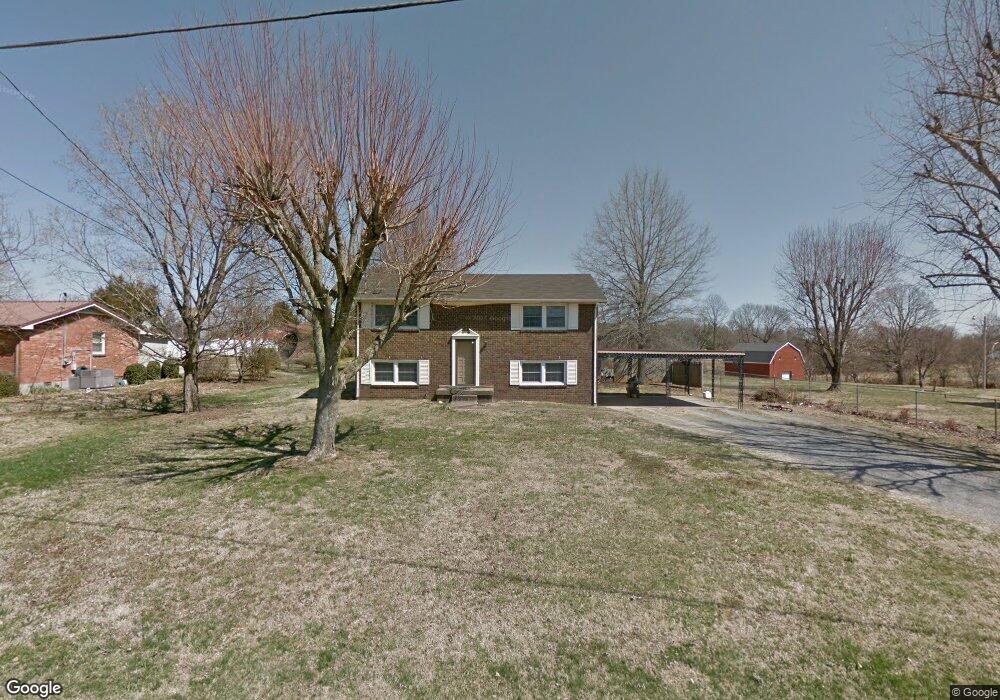
1903 Pinnacle Rd Pleasant View, TN 37146
Estimated Value: $276,523 - $356,000
--
Bed
2
Baths
1,850
Sq Ft
$176/Sq Ft
Est. Value
About This Home
This home is located at 1903 Pinnacle Rd, Pleasant View, TN 37146 and is currently estimated at $326,381, approximately $176 per square foot. 1903 Pinnacle Rd is a home located in Cheatham County with nearby schools including Pleasant View Elementary School, Sycamore Middle School, and Sycamore High School.
Ownership History
Date
Name
Owned For
Owner Type
Purchase Details
Closed on
Jun 15, 2007
Sold by
Henderson Larry E and Henderson Amber
Bought by
Walker Gary P and Walker Barbara J
Current Estimated Value
Home Financials for this Owner
Home Financials are based on the most recent Mortgage that was taken out on this home.
Original Mortgage
$135,000
Outstanding Balance
$81,669
Interest Rate
6.16%
Estimated Equity
$244,712
Purchase Details
Closed on
Dec 19, 2003
Sold by
Cook Phillip L and Cook Brenda K
Bought by
Henderson Larry E
Home Financials for this Owner
Home Financials are based on the most recent Mortgage that was taken out on this home.
Original Mortgage
$113,705
Interest Rate
6.05%
Purchase Details
Closed on
Aug 31, 1993
Bought by
Cook Phillip L and Cook Brenda K
Purchase Details
Closed on
Jul 24, 1972
Bought by
Binkley Madell K and Mary Ruth
Create a Home Valuation Report for This Property
The Home Valuation Report is an in-depth analysis detailing your home's value as well as a comparison with similar homes in the area
Home Values in the Area
Average Home Value in this Area
Purchase History
| Date | Buyer | Sale Price | Title Company |
|---|---|---|---|
| Walker Gary P | $135,000 | -- | |
| Henderson Larry E | $112,000 | -- | |
| Cook Phillip L | $77,000 | -- | |
| Binkley Madell K | -- | -- |
Source: Public Records
Mortgage History
| Date | Status | Borrower | Loan Amount |
|---|---|---|---|
| Open | Binkley Madell K | $135,000 | |
| Previous Owner | Binkley Madell K | $113,705 |
Source: Public Records
Tax History Compared to Growth
Tax History
| Year | Tax Paid | Tax Assessment Tax Assessment Total Assessment is a certain percentage of the fair market value that is determined by local assessors to be the total taxable value of land and additions on the property. | Land | Improvement |
|---|---|---|---|---|
| 2025 | $1,110 | $69,775 | $0 | $0 |
| 2024 | $1,110 | $69,775 | $13,075 | $56,700 |
| 2023 | $1,144 | $44,025 | $4,625 | $39,400 |
| 2022 | $1,090 | $44,025 | $4,625 | $39,400 |
| 2021 | $1,090 | $44,025 | $4,625 | $39,400 |
| 2020 | $1,090 | $44,025 | $4,625 | $39,400 |
| 2019 | $1,090 | $44,025 | $4,625 | $39,400 |
| 2018 | $1,077 | $36,800 | $4,625 | $32,175 |
| 2017 | $1,015 | $36,800 | $4,625 | $32,175 |
| 2016 | $962 | $36,800 | $4,625 | $32,175 |
| 2015 | $867 | $31,175 | $4,625 | $26,550 |
| 2014 | $867 | $31,175 | $4,625 | $26,550 |
Source: Public Records
Map
Nearby Homes
- 207 Charleston Ave
- 203 Charleston Ave
- 199 Charleston Ave
- 195 Charleston Ave
- 191 Charleston Ave
- 187 Charleston Ave
- 179 Charleston Ave
- 183 Charleston Ave
- 110 Gower St
- 116 Gower St
- 241 Franklin St
- 244 Franklin St
- 537 Centre St
- 232 Franklin St
- 238 Franklin St
- 262 Franklin St
- 6150 Highway 41a
- 209 Augusta Ave
- 140 Pocono Dr
- 268 Daniel St
- 1901 Pinnacle Rd
- 1905 Pinnacle Rd
- 107 Pinnacle Ct
- 111 Pinnacle Ct
- 1887 Pinnacle Rd
- 1907 Pinnacle Rd
- 92 Pinnacle Ct
- 1881 Pinnacle Rd
- 2006 Pinnacle Rd
- 2007 Pinnacle Rd
- 2109 Pinnacle Cir
- 1875 Pinnacle Rd
- 2115 Pinnacle Cir
- 2119 Pinnacle Cir
- 2121 Pinnacle Cir
- 2120 Pinnacle Cir
- 1995 S Walker Rd
- 2123 Pinnacle Cir
- 2127 Pinnacle Cir
- 1971 S Walker Rd