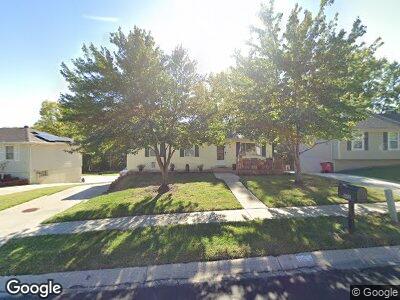
1905 N Grove Dr Independence, MO 64058
Estimated Value: $182,207 - $190,000
3
Beds
1
Bath
902
Sq Ft
$208/Sq Ft
Est. Value
About This Home
This home is located at 1905 N Grove Dr, Independence, MO 64058 and is currently estimated at $187,302, approximately $207 per square foot. 1905 N Grove Dr is a home located in Jackson County with nearby schools including Fort Osage High School.
Ownership History
Date
Name
Owned For
Owner Type
Purchase Details
Closed on
Sep 29, 2004
Sold by
Mortgage Electronic Registration Systems
Bought by
Ferguson Randy
Current Estimated Value
Home Financials for this Owner
Home Financials are based on the most recent Mortgage that was taken out on this home.
Original Mortgage
$85,209
Interest Rate
5.66%
Mortgage Type
FHA
Purchase Details
Closed on
Jul 7, 2004
Sold by
Williams Douglas A and Williams Jennifer L
Bought by
Mortgage Electronic Registration Systems
Purchase Details
Closed on
Feb 24, 2003
Sold by
Williams Douglas A and Greathouse Jennifer L
Bought by
Williams Douglas A and Williams Jennifer L
Home Financials for this Owner
Home Financials are based on the most recent Mortgage that was taken out on this home.
Original Mortgage
$90,500
Interest Rate
7.74%
Mortgage Type
Purchase Money Mortgage
Purchase Details
Closed on
Oct 25, 2000
Sold by
Lindsey Tony A and Lindsey Cheryl D
Bought by
Williams Douglas A and Greathouse Jennifer L
Home Financials for this Owner
Home Financials are based on the most recent Mortgage that was taken out on this home.
Original Mortgage
$76,687
Interest Rate
7.89%
Mortgage Type
FHA
Create a Home Valuation Report for This Property
The Home Valuation Report is an in-depth analysis detailing your home's value as well as a comparison with similar homes in the area
Home Values in the Area
Average Home Value in this Area
Purchase History
| Date | Buyer | Sale Price | Title Company |
|---|---|---|---|
| Ferguson Randy | -- | -- | |
| Mortgage Electronic Registration Systems | $85,000 | -- | |
| Williams Douglas A | -- | Realty Title Company | |
| Williams Douglas A | -- | Stewart Title |
Source: Public Records
Mortgage History
| Date | Status | Borrower | Loan Amount |
|---|---|---|---|
| Closed | Ferguson Randy | $80,265 | |
| Closed | Ferguson Randy | $85,209 | |
| Previous Owner | Williams Douglas A | $90,500 | |
| Previous Owner | Williams Douglas A | $76,687 |
Source: Public Records
Tax History Compared to Growth
Tax History
| Year | Tax Paid | Tax Assessment Tax Assessment Total Assessment is a certain percentage of the fair market value that is determined by local assessors to be the total taxable value of land and additions on the property. | Land | Improvement |
|---|---|---|---|---|
| 2024 | $1,577 | $17,786 | $2,390 | $15,396 |
| 2023 | $1,577 | $17,786 | $2,521 | $15,265 |
| 2022 | $1,760 | $18,810 | $2,738 | $16,072 |
| 2021 | $1,762 | $18,810 | $2,738 | $16,072 |
| 2020 | $1,668 | $17,554 | $2,738 | $14,816 |
| 2019 | $1,635 | $17,554 | $2,738 | $14,816 |
| 2018 | $1,429 | $15,278 | $2,383 | $12,895 |
| 2017 | $1,286 | $15,278 | $2,383 | $12,895 |
| 2016 | $1,286 | $14,895 | $2,126 | $12,769 |
| 2014 | $1,266 | $14,604 | $2,085 | $12,519 |
Source: Public Records
Map
Nearby Homes
- 1912 N Grove Dr
- 1908 N Ponca Dr
- 1711 S Concord Ct
- 1606 N Ponca Dr
- 1910 N Vista St
- 2210 N Salem Dr
- 18313 E Shoshone Dr
- 18808 E 22nd Terrace N
- 1907 N Plymouth Ct
- 18900 E Manor Dr
- 18806 E Manor Dr
- 19204 E 15th Terrace Ct N
- 19213 E 15th Terrace Ct N
- 1448 N Inca Dr
- 19210 E Colony Ct
- 19145 E 15th St N
- 1617 N Jones Ct
- 19708 E 17th Terrace N
- 1400 N Inca Dr
- 11105 E 24 Highway Cir
- 1905 N Grove Dr
- 1907 N Grove Dr
- 1903 N Grove Dr
- 1909 N Grove Dr
- 1901 N Grove Dr
- 1900 N Grove Dr
- 1910 N Grove Dr
- 1821 N Grove Dr
- 1911 N Grove Dr
- 1822 N Grove Dr
- 1908 N Grove Dr
- 1902 N Grove Dr
- 1818 N Lazy Branch Rd
- 1819 N Grove Dr
- 1820 N Grove Dr
- 1820 N Lazy Branch Rd
- 1906 N Grove Dr
- 1816 N Lazy Branch Rd
- 1915 Grove Dr
- 1822 N Lazy Branch Rd