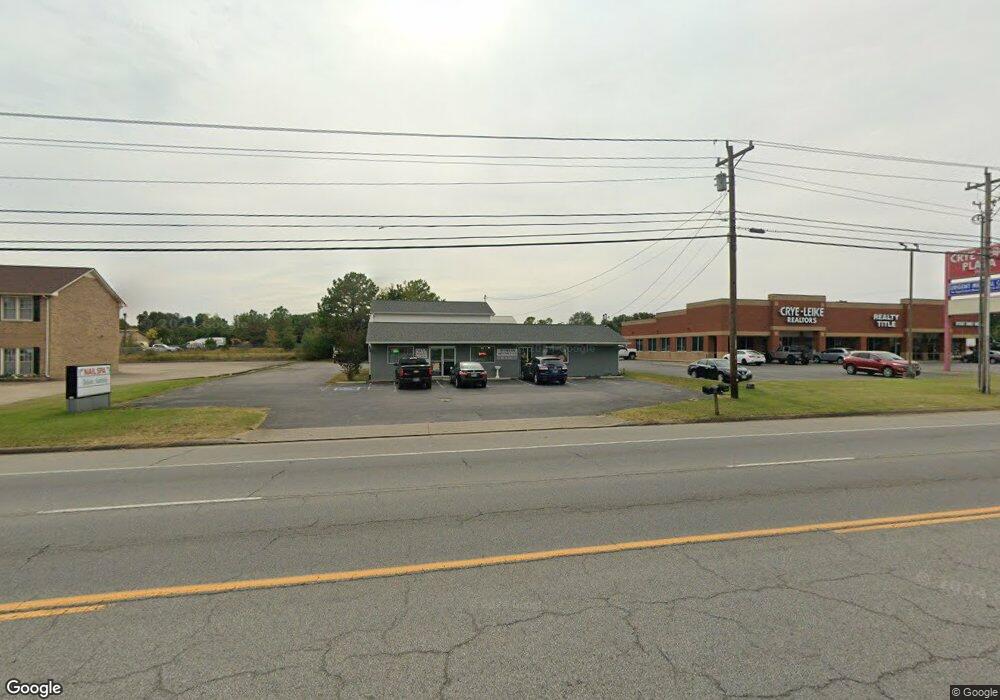
1906 Highway 46 S Dickson, TN 37055
Estimated Value: $785,443
--
Bed
2
Baths
4,776
Sq Ft
$164/Sq Ft
Est. Value
About This Home
This home is located at 1906 Highway 46 S, Dickson, TN 37055 and is currently estimated at $785,443, approximately $164 per square foot. 1906 Highway 46 S is a home located in Dickson County with nearby schools including Oakmont Elementary School, Burns Middle School, and Dickson County High School.
Ownership History
Date
Name
Owned For
Owner Type
Purchase Details
Closed on
Jan 13, 2017
Sold by
Neal Jeff
Bought by
Mcewen Thornton Llc
Current Estimated Value
Home Financials for this Owner
Home Financials are based on the most recent Mortgage that was taken out on this home.
Original Mortgage
$240,000
Outstanding Balance
$198,007
Interest Rate
4.16%
Mortgage Type
Commercial
Estimated Equity
$587,436
Purchase Details
Closed on
Oct 18, 2002
Sold by
Hogin Family Partnership L
Bought by
Neal Jeff
Purchase Details
Closed on
Aug 19, 1997
Sold by
Garton Bernice and Garton Claudine
Bought by
Hogin Jackie and Hogin Kathy
Purchase Details
Closed on
Mar 19, 1997
Sold by
Garton Bernice M
Bought by
Garton Bernice and Garton Claudine
Purchase Details
Closed on
Dec 9, 1988
Bought by
Garton Bernice M and Dennis Garton
Purchase Details
Closed on
Jan 1, 1983
Bought by
Frazier James E and Frazier Carlene
Create a Home Valuation Report for This Property
The Home Valuation Report is an in-depth analysis detailing your home's value as well as a comparison with similar homes in the area
Home Values in the Area
Average Home Value in this Area
Purchase History
| Date | Buyer | Sale Price | Title Company |
|---|---|---|---|
| Mcewen Thornton Llc | $375,000 | -- | |
| Neal Jeff | $260,000 | -- | |
| Hogin Jackie | $130,000 | -- | |
| Garton Bernice | -- | -- | |
| Garton Bernice M | $80,000 | -- | |
| Frazier James E | $15,000 | -- |
Source: Public Records
Mortgage History
| Date | Status | Borrower | Loan Amount |
|---|---|---|---|
| Open | Mcewen Thornton Llc | $240,000 |
Source: Public Records
Tax History Compared to Growth
Tax History
| Year | Tax Paid | Tax Assessment Tax Assessment Total Assessment is a certain percentage of the fair market value that is determined by local assessors to be the total taxable value of land and additions on the property. | Land | Improvement |
|---|---|---|---|---|
| 2024 | $5,714 | $229,040 | $129,120 | $99,920 |
| 2023 | $5,714 | $182,920 | $106,520 | $76,400 |
| 2022 | $5,714 | $182,920 | $106,520 | $76,400 |
| 2021 | $5,714 | $182,920 | $106,520 | $76,400 |
| 2020 | $5,714 | $182,920 | $106,520 | $76,400 |
| 2019 | $5,714 | $182,920 | $106,520 | $76,400 |
| 2018 | $5,382 | $147,480 | $72,000 | $75,480 |
| 2017 | $5,382 | $147,480 | $72,000 | $75,480 |
| 2016 | $5,382 | $147,480 | $72,000 | $75,480 |
| 2015 | $5,721 | $147,480 | $72,000 | $75,480 |
| 2014 | $5,721 | $147,480 | $72,000 | $75,480 |
Source: Public Records
Map
Nearby Homes
- 106 Hogin Rd
- 0 Hogan Rd
- 120 Mae Cir
- 100 Short St
- 113 Mae Cir
- 118 Spanish Ct
- 128 Robin Hood Rd
- 126 Robin Hood Rd
- 109 Robin Hood Rd
- 1480 Pomona Rd
- 634 Whirlaway Dr
- The Pinehurst Plan at Ironhorse
- The Sonoma Plan at Ironhorse
- 405 Barbaro Ct
- 133 Ironhorse Way
- 122 Ironhorse Way
- 126 Ironhorse Way
- 128 Ironhorse Way
- 120 Ironhorse Way
- 113 Ironhorse Way