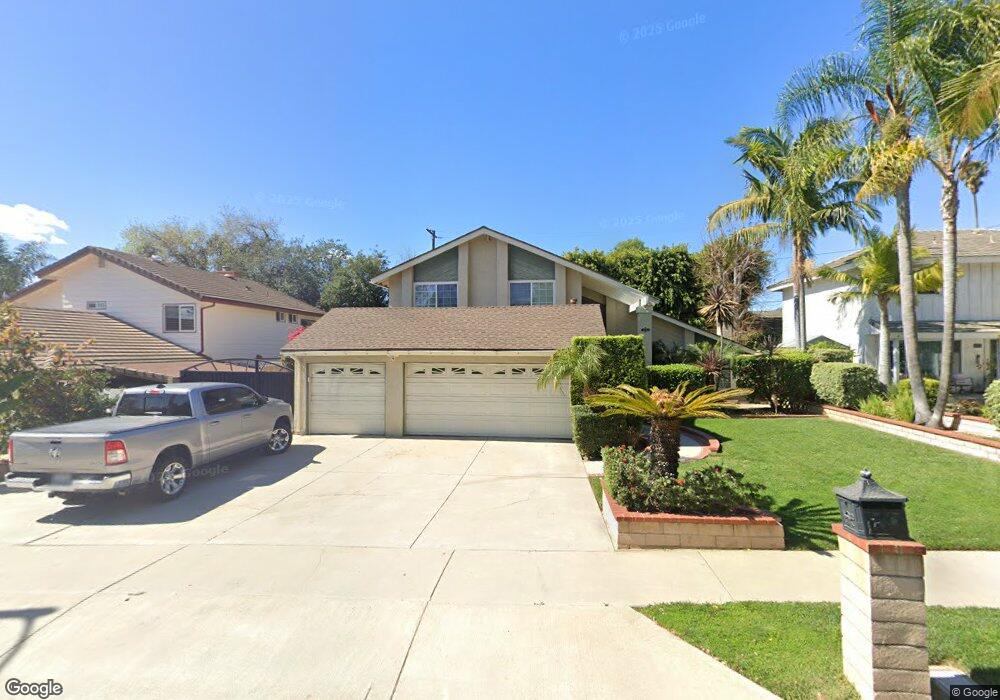
1907 Gilman Cir Placentia, CA 92870
Estimated Value: $1,180,550 - $1,303,000
4
Beds
3
Baths
2,304
Sq Ft
$536/Sq Ft
Est. Value
About This Home
This home is located at 1907 Gilman Cir, Placentia, CA 92870 and is currently estimated at $1,235,638, approximately $536 per square foot. 1907 Gilman Cir is a home located in Orange County with nearby schools including Sierra Vista Elementary School, Col. J. K. Tuffree Middle School, and El Dorado High School.
Ownership History
Date
Name
Owned For
Owner Type
Purchase Details
Closed on
Sep 23, 2020
Sold by
Rauch Brian and Rauch Jennifer
Bought by
Rauch Brian and Rauch Jennifer
Current Estimated Value
Home Financials for this Owner
Home Financials are based on the most recent Mortgage that was taken out on this home.
Original Mortgage
$214,000
Outstanding Balance
$152,714
Interest Rate
2.9%
Mortgage Type
New Conventional
Estimated Equity
$1,082,924
Purchase Details
Closed on
May 28, 2015
Sold by
Rauch Brian and Rauch Jennifer
Bought by
Brian & Jennifer Rauch Living Trust
Purchase Details
Closed on
Jul 28, 1998
Sold by
Robeck Nancy S
Bought by
Rauch Brian and Rauch Jennifer
Home Financials for this Owner
Home Financials are based on the most recent Mortgage that was taken out on this home.
Original Mortgage
$215,920
Interest Rate
6.93%
Mortgage Type
Stand Alone First
Create a Home Valuation Report for This Property
The Home Valuation Report is an in-depth analysis detailing your home's value as well as a comparison with similar homes in the area
Home Values in the Area
Average Home Value in this Area
Purchase History
| Date | Buyer | Sale Price | Title Company |
|---|---|---|---|
| Rauch Brian | -- | Lawyers Title Company | |
| Rauch Brian | -- | Lawyers Title Company | |
| Brian & Jennifer Rauch Living Trust | -- | None Available | |
| Rauch Brian | $270,000 | Fidelity National Title Ins |
Source: Public Records
Mortgage History
| Date | Status | Borrower | Loan Amount |
|---|---|---|---|
| Open | Rauch Brian | $214,000 | |
| Closed | Rauch Brian | $215,920 | |
| Closed | Rauch Brian | $26,990 |
Source: Public Records
Tax History
| Year | Tax Paid | Tax Assessment Tax Assessment Total Assessment is a certain percentage of the fair market value that is determined by local assessors to be the total taxable value of land and additions on the property. | Land | Improvement |
|---|---|---|---|---|
| 2025 | $5,203 | $423,118 | $246,135 | $176,983 |
| 2024 | $5,203 | $414,822 | $241,309 | $173,513 |
| 2023 | $5,081 | $406,689 | $236,578 | $170,111 |
| 2022 | $4,990 | $398,715 | $231,939 | $166,776 |
| 2021 | $4,857 | $390,898 | $227,392 | $163,506 |
| 2020 | $4,871 | $386,890 | $225,060 | $161,830 |
| 2019 | $4,671 | $379,304 | $220,647 | $158,657 |
| 2018 | $4,608 | $371,867 | $216,320 | $155,547 |
| 2017 | $4,528 | $364,576 | $212,078 | $152,498 |
| 2016 | $4,437 | $357,428 | $207,920 | $149,508 |
| 2015 | $4,378 | $352,060 | $204,797 | $147,263 |
| 2014 | $4,255 | $345,164 | $200,785 | $144,379 |
Source: Public Records
Map
Nearby Homes
- 2454 Beacon St
- 2541 Thorn Place
- 1714 Saint James Place
- 2760 Quail Ridge Cir Unit 57
- 2733 Quail Ridge Cir Unit 32
- 1714 Sierra Bonita Dr
- 2625 Andover Ave
- 3010 Associated Rd Unit 122
- 3000 Associated Rd Unit 60
- 3062 Associated Rd Unit 1
- 3054 Associated Rd Unit 20
- 2155 Associated Rd Unit 12
- 2851 Rolling Hills Dr Unit 257
- 2851 Rolling Hills Dr Unit 248
- 2851 Rolling Hills Dr
- 3024 Topaz Ln
- 1714 Kingston Rd
- 2040 Woodbriar Ct
- 2938 Barrington Ct
- 1536 Windsor Ln
- 1913 Gilman Cir
- 1901 Gilman Cir
- 2406 Cambridge Ave
- 2400 Cambridge Ave
- 1919 Gilman Cir
- 2412 Cambridge Ave
- 2418 Cambridge Ave
- 1925 Gilman Cir
- 1849 Barker Way
- 2424 Cambridge Ave
- 1848 Cambridge Ave
- 1931 Gilman Cir
- 1848 Barker Way
- 2407 Cambridge Ave
- 2401 Cambridge Ave
- 2413 Cambridge Ave
- 1843 Barker Way
- 2430 Cambridge Ave
- 1842 Barker Way
- 2419 Cambridge Ave
Your Personal Tour Guide
Ask me questions while you tour the home.