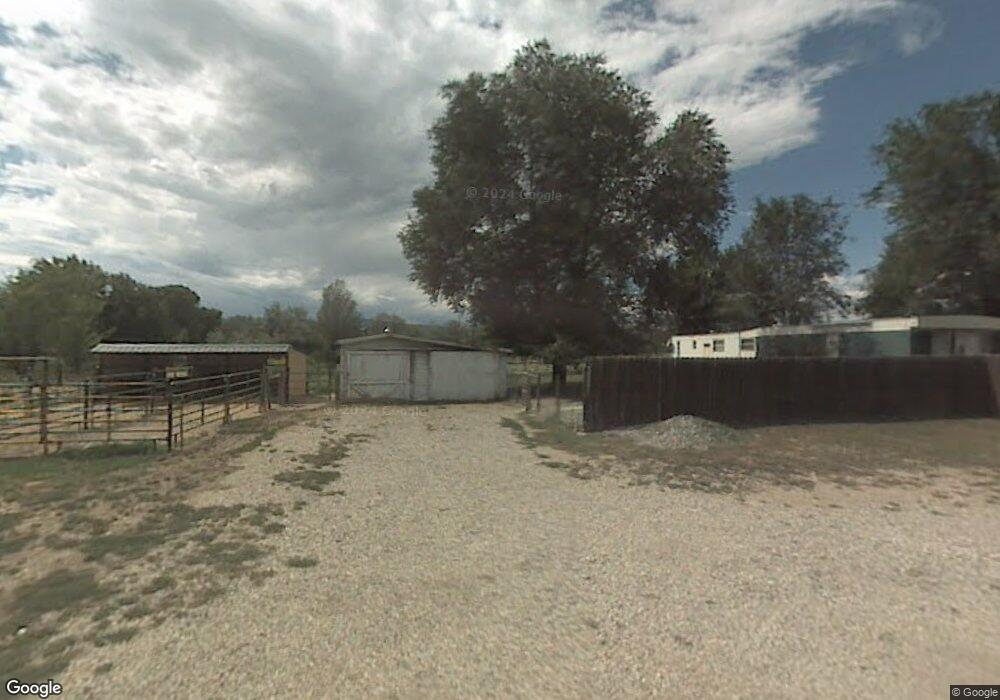
1907 N Whitcomb St Fort Collins, CO 80524
Estimated Value: $406,000 - $775,717
3
Beds
2
Baths
2,280
Sq Ft
$291/Sq Ft
Est. Value
About This Home
This home is located at 1907 N Whitcomb St, Fort Collins, CO 80524 and is currently estimated at $664,429, approximately $291 per square foot. 1907 N Whitcomb St is a home with nearby schools including Irish Elementary School, Lincoln Middle School, and Poudre High School.
Ownership History
Date
Name
Owned For
Owner Type
Purchase Details
Closed on
Oct 1, 2014
Sold by
Shalberg Lori L
Bought by
Brown Mitchell F and Brown Sherri A
Current Estimated Value
Home Financials for this Owner
Home Financials are based on the most recent Mortgage that was taken out on this home.
Original Mortgage
$110,000
Outstanding Balance
$84,331
Interest Rate
4.1%
Mortgage Type
Purchase Money Mortgage
Estimated Equity
$580,098
Purchase Details
Closed on
Apr 6, 1998
Sold by
Hately James E and Hately Jo E
Bought by
Schalberg Lori L
Home Financials for this Owner
Home Financials are based on the most recent Mortgage that was taken out on this home.
Original Mortgage
$75,000
Interest Rate
7.17%
Mortgage Type
Seller Take Back
Purchase Details
Closed on
Nov 1, 1995
Sold by
Gaines Laurie
Bought by
Hately James E
Purchase Details
Closed on
Jan 1, 1994
Sold by
Schaeffer Barbara A
Bought by
Gaines Laurie
Create a Home Valuation Report for This Property
The Home Valuation Report is an in-depth analysis detailing your home's value as well as a comparison with similar homes in the area
Home Values in the Area
Average Home Value in this Area
Purchase History
| Date | Buyer | Sale Price | Title Company |
|---|---|---|---|
| Brown Mitchell F | $115,000 | Fidelity National Title Ins | |
| Schalberg Lori L | $80,000 | -- | |
| Hately James E | $65,500 | -- | |
| Gaines Laurie | $59,500 | -- |
Source: Public Records
Mortgage History
| Date | Status | Borrower | Loan Amount |
|---|---|---|---|
| Open | Brown Mitchell F | $110,000 | |
| Previous Owner | Schalberg Lori L | $75,000 |
Source: Public Records
Tax History Compared to Growth
Tax History
| Year | Tax Paid | Tax Assessment Tax Assessment Total Assessment is a certain percentage of the fair market value that is determined by local assessors to be the total taxable value of land and additions on the property. | Land | Improvement |
|---|---|---|---|---|
| 2025 | $3,696 | $41,708 | $4,925 | $36,783 |
| 2024 | $3,519 | $41,708 | $4,925 | $36,783 |
| 2022 | $2,800 | $29,336 | $5,108 | $24,228 |
| 2021 | $2,825 | $30,180 | $5,255 | $24,925 |
| 2020 | $2,765 | $29,293 | $5,255 | $24,038 |
| 2019 | $2,778 | $29,293 | $5,255 | $24,038 |
| 2018 | $2,571 | $27,965 | $5,292 | $22,673 |
| 2017 | $2,562 | $27,965 | $5,292 | $22,673 |
| 2016 | $1,742 | $18,913 | $5,851 | $13,062 |
| 2015 | $1,949 | $21,320 | $21,320 | $0 |
| 2014 | $934 | $10,150 | $10,150 | $0 |
Source: Public Records
Map
Nearby Homes
- 1601 N College Ave Unit 342
- 1601 N College Ave Unit 338
- 1601 N College Ave Unit 287
- 1601 N College Ave Unit 300
- 1601 N College Ave Unit 44
- 1601 N College Ave Unit 296
- 1601 N College Ave Unit 282
- 400 Hickory St Unit 172
- 124 Meadow Ln
- 1746 Valley View Ln
- 312 Butch Cassidy Dr Unit 4
- 2704 N Shields St Unit 7
- 762 Harts Gardens Ln
- 747 Peregoy Farms Way
- 757 Harts Gardens Ln
- 326 Osiander St Unit C
- 332 Osiander St
- 262 Cajetan St
- 232 Pascal St
- 1225 Alameda St
- 1929 N Whitcomb St
- 1930 N Whitcomb St
- 1721 N Whitcomb St
- 2016 N Whitcomb St
- 2024 N Whitcomb St
- 2096 N Whitcomb St
- 2010 N Whitcomb St
- 603 W Willox Ln
- 420 W Willox Ln
- 430 W Willox Ln
- 2224 N Shields St
- 862 W Willox Ln
- 505 W Willox Ln
- 1639 Treeline Place
- 414 W Willox Ln
- 429 W Willox Ln
- 1642 Treeline Place
- 408 W Willox Ln
- 719 W Willox Ln
- 508 Westwood Dr