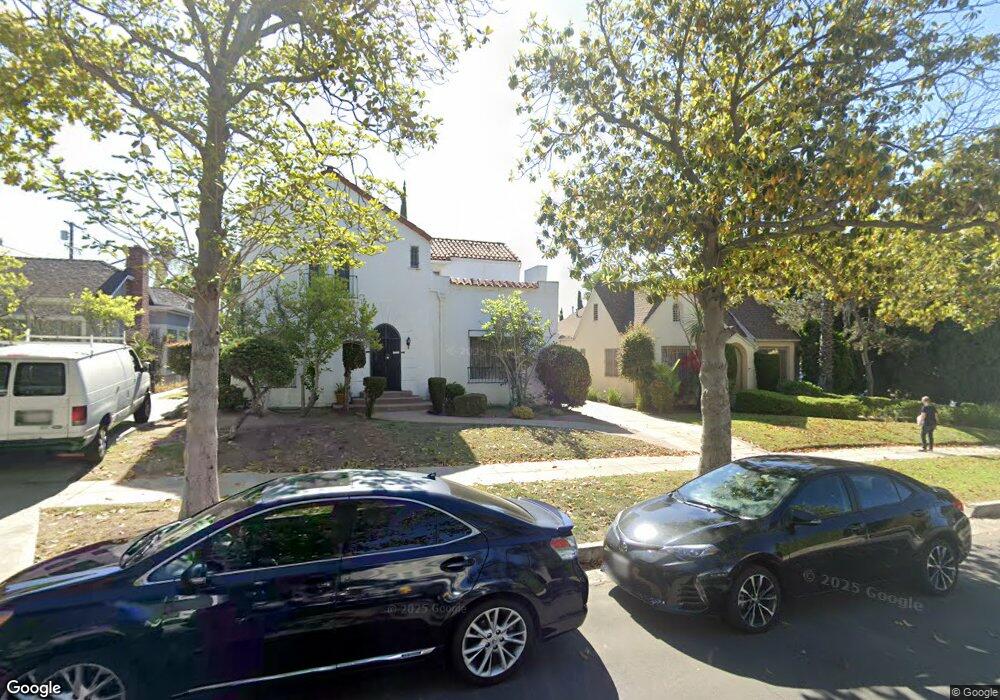
1908 N Catalina St Los Angeles, CA 90027
Los Feliz NeighborhoodEstimated Value: $1,946,663 - $2,455,000
5
Beds
3
Baths
2,609
Sq Ft
$843/Sq Ft
Est. Value
About This Home
This home is located at 1908 N Catalina St, Los Angeles, CA 90027 and is currently estimated at $2,199,416, approximately $843 per square foot. 1908 N Catalina St is a home located in Los Angeles County with nearby schools including Los Feliz STEMM Magnet, Thomas Starr King Middle School Film and Media Magnet, and John Marshall Senior High.
Ownership History
Date
Name
Owned For
Owner Type
Purchase Details
Closed on
Feb 3, 2024
Sold by
Yet And Fay Wong Trust
Bought by
Wong Ron E and Wong Perry T
Current Estimated Value
Purchase Details
Closed on
Mar 21, 1994
Sold by
Wong Yet C and Wong Fay M
Bought by
Wong Yet C
Home Financials for this Owner
Home Financials are based on the most recent Mortgage that was taken out on this home.
Original Mortgage
$470,000
Interest Rate
7.21%
Purchase Details
Closed on
Mar 4, 1994
Sold by
Wong Yet C and Wong Fay M
Bought by
Wong Yet C
Home Financials for this Owner
Home Financials are based on the most recent Mortgage that was taken out on this home.
Original Mortgage
$470,000
Interest Rate
7.21%
Purchase Details
Closed on
Mar 2, 1994
Sold by
Wong Yet C and Wong Fay M
Bought by
Wong Yet C
Home Financials for this Owner
Home Financials are based on the most recent Mortgage that was taken out on this home.
Original Mortgage
$470,000
Interest Rate
7.21%
Create a Home Valuation Report for This Property
The Home Valuation Report is an in-depth analysis detailing your home's value as well as a comparison with similar homes in the area
Home Values in the Area
Average Home Value in this Area
Purchase History
| Date | Buyer | Sale Price | Title Company |
|---|---|---|---|
| Wong Ron E | -- | None Listed On Document | |
| Wong Yet C | -- | Fidelity National Title | |
| Wong Yet C | -- | Fidelity National Title Ins | |
| Wong Yet C | -- | Fidelity National Title | |
| Wong Yet C | -- | Fidelity National Title | |
| Wong Yet C | -- | Fidelity National Title |
Source: Public Records
Mortgage History
| Date | Status | Borrower | Loan Amount |
|---|---|---|---|
| Previous Owner | Wong Yet C | $470,000 | |
| Previous Owner | Wong Yet C | $980,000 | |
| Previous Owner | Wong Yet C | $472,500 | |
| Previous Owner | Wong Yet C | $260,000 | |
| Previous Owner | Wong Yet C | $490,000 |
Source: Public Records
Tax History Compared to Growth
Tax History
| Year | Tax Paid | Tax Assessment Tax Assessment Total Assessment is a certain percentage of the fair market value that is determined by local assessors to be the total taxable value of land and additions on the property. | Land | Improvement |
|---|---|---|---|---|
| 2025 | $2,682 | $1,963,234 | $1,644,872 | $318,362 |
| 2024 | $2,682 | $189,377 | $73,279 | $116,098 |
| 2023 | $2,553 | $185,665 | $71,843 | $113,822 |
| 2022 | $2,443 | $182,026 | $70,435 | $111,591 |
| 2021 | $2,398 | $178,457 | $69,054 | $109,403 |
| 2019 | $2,330 | $173,165 | $67,006 | $106,159 |
| 2018 | $2,238 | $169,771 | $65,693 | $104,078 |
| 2016 | $2,110 | $163,181 | $63,143 | $100,038 |
| 2015 | $2,081 | $160,731 | $62,195 | $98,536 |
| 2014 | $2,095 | $157,583 | $60,977 | $96,606 |
Source: Public Records
Map
Nearby Homes
- 1901 N Catalina St
- 1845 N New Hampshire Ave
- 1754 N Berendo St
- 1930 N Vermont Ave Unit 201
- 1930 N Vermont Ave Unit 207
- 1964 Palmerston Place
- 1860 Alexandria Ave
- 1832 N Alexandria Ave
- 1748 N Kenmore Ave Unit 203
- 1730 N Berendo St
- 2041 N Vermont Ave
- 1730 N Kenmore Ave
- 2073 N Catalina St
- 4953 Ambrose Ave
- 1727 N Kenmore Ave
- 1979 N Alexandria Ave
- 1982 N Normandie Ave
- 1927 N Normandie Ave
- 4579 Ambrose Ave Unit 8
- 1860 Winona Blvd
- 1914 N Catalina St
- 1900 N Catalina St
- 1909 N Berendo St
- 1915 N Berendo St
- 1901 N Berendo St
- 1924 N Catalina St
- 1919 N Berendo St
- 1909 N Catalina St
- 1915 N Catalina St
- 1925 N Berendo St
- 1928 N Catalina St
- 1919 N Catalina St
- 4808 Franklin Ave
- 1929 N Berendo St
- 1925 N Catalina St
- 4816 Franklin Ave
- 1934 N Catalina St
- 1929 N Catalina St
- 1935 N Berendo St
- 1849 N Berendo St