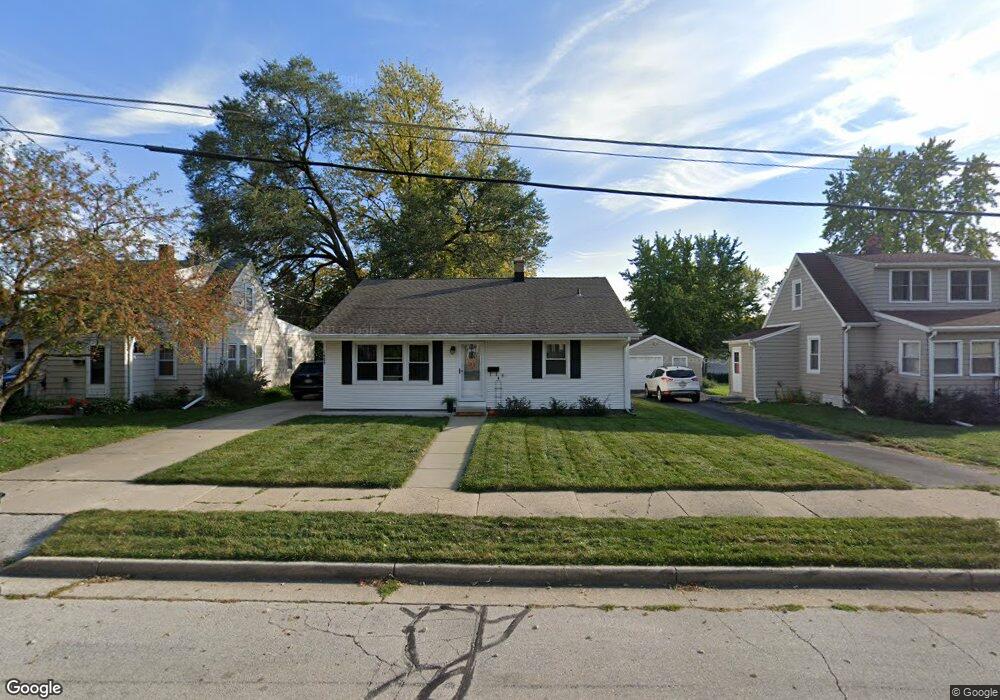
1909 Brad St Waukesha, WI 53188
Estimated Value: $281,000 - $296,000
4
Beds
2
Baths
1,326
Sq Ft
$219/Sq Ft
Est. Value
About This Home
This home is located at 1909 Brad St, Waukesha, WI 53188 and is currently estimated at $290,501, approximately $219 per square foot. 1909 Brad St is a home located in Waukesha County with nearby schools including Summit View Elementary School, Butler Middle School, and North High School.
Ownership History
Date
Name
Owned For
Owner Type
Purchase Details
Closed on
Oct 17, 2014
Sold by
Fenske James H and Fenske Ina L
Bought by
Fenske James H
Current Estimated Value
Purchase Details
Closed on
Mar 22, 2013
Sold by
Standarski Eirc L and Standarski Carolyn J
Bought by
Oleske Jacob
Home Financials for this Owner
Home Financials are based on the most recent Mortgage that was taken out on this home.
Original Mortgage
$119,691
Outstanding Balance
$83,809
Interest Rate
3.37%
Mortgage Type
FHA
Estimated Equity
$206,692
Purchase Details
Closed on
Jul 9, 2012
Sold by
Paulbicke Howard R
Bought by
Landmark Credit Union
Purchase Details
Closed on
Mar 20, 2007
Sold by
Fenske James H and Fenske Ina L
Bought by
Fenske James H and Fenske Ina L
Purchase Details
Closed on
Jun 18, 2004
Sold by
Paulbicke Cheryl Diane
Bought by
Paulbicke Howard Ralph
Create a Home Valuation Report for This Property
The Home Valuation Report is an in-depth analysis detailing your home's value as well as a comparison with similar homes in the area
Home Values in the Area
Average Home Value in this Area
Purchase History
| Date | Buyer | Sale Price | Title Company |
|---|---|---|---|
| Fenske James H | -- | None Available | |
| Oleske Jacob | $121,900 | None Available | |
| Landmark Credit Union | $80,000 | -- | |
| Fenske James H | -- | None Available | |
| Paulbicke Howard Ralph | -- | -- |
Source: Public Records
Mortgage History
| Date | Status | Borrower | Loan Amount |
|---|---|---|---|
| Open | Oleske Jacob | $119,691 |
Source: Public Records
Tax History Compared to Growth
Tax History
| Year | Tax Paid | Tax Assessment Tax Assessment Total Assessment is a certain percentage of the fair market value that is determined by local assessors to be the total taxable value of land and additions on the property. | Land | Improvement |
|---|---|---|---|---|
| 2024 | $2,904 | $201,200 | $53,100 | $148,100 |
| 2023 | $2,807 | $201,200 | $53,100 | $148,100 |
| 2022 | $2,933 | $157,000 | $52,600 | $104,400 |
| 2021 | $2,991 | $157,000 | $52,600 | $104,400 |
| 2020 | $2,907 | $157,000 | $52,600 | $104,400 |
| 2019 | $2,968 | $157,000 | $52,600 | $104,400 |
| 2018 | $2,713 | $141,400 | $43,100 | $98,300 |
| 2017 | $2,683 | $141,400 | $43,100 | $98,300 |
| 2016 | $2,785 | $137,300 | $40,200 | $97,100 |
| 2015 | $2,760 | $137,300 | $40,200 | $97,100 |
| 2014 | $2,740 | $130,800 | $40,200 | $90,600 |
| 2013 | $2,740 | $130,800 | $40,200 | $90,600 |
Source: Public Records
Map
Nearby Homes
- 704 Western Ave
- 1901 Wall St
- 630 Westowne Ave
- 1811 Summit Ave
- 608 N Grandview Blvd
- 2207 Norwood Dr
- 2300 Norwood Dr
- 2012 Sunkist Ave
- 1513 N Bel Ayr Dr
- 331 Jasper Ln
- 1606 Pleasant View Ave
- 1505 Elder St
- 1954 Cascade Dr
- 1223 Wilshire Place
- 610 Glendon Way
- 511 N Washington Ave
- 2145 Broken Hill Rd Unit 5
- 2508 Manchester Ct
- 1917 Tree Line Ct
- 1911 Woodburn Rd Unit C