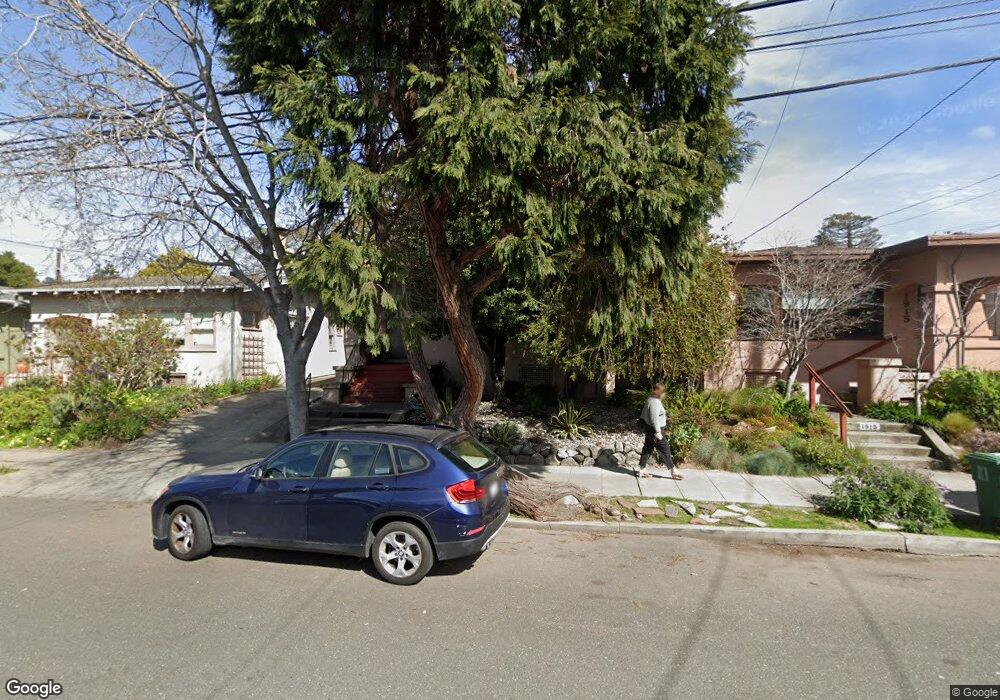
1909 Grant St Berkeley, CA 94703
Downtown Berkeley NeighborhoodEstimated Value: $1,216,302 - $1,595,000
2
Beds
1
Bath
1,790
Sq Ft
$796/Sq Ft
Est. Value
About This Home
This home is located at 1909 Grant St, Berkeley, CA 94703 and is currently estimated at $1,424,076, approximately $795 per square foot. 1909 Grant St is a home located in Alameda County with nearby schools including Berkeley Arts Magnet at Whittier School, Washington Elementary School, and Oxford Elementary School.
Ownership History
Date
Name
Owned For
Owner Type
Purchase Details
Closed on
Jan 4, 2019
Sold by
Woodson Letitia Y and The Letitia Y Woodson Living T
Bought by
Woodson Letitia Y and The Letitia Y Woodson Living T
Current Estimated Value
Home Financials for this Owner
Home Financials are based on the most recent Mortgage that was taken out on this home.
Original Mortgage
$1,680,000
Outstanding Balance
$1,480,046
Interest Rate
4.7%
Mortgage Type
Reverse Mortgage Home Equity Conversion Mortgage
Estimated Equity
-$55,970
Purchase Details
Closed on
Nov 6, 2014
Sold by
Woodson Letitia W and Letitia Y Woodson Living Trust
Bought by
Woodson Letitia Y and Letitia Y Woodson Living Trust
Home Financials for this Owner
Home Financials are based on the most recent Mortgage that was taken out on this home.
Original Mortgage
$938,250
Interest Rate
2.53%
Mortgage Type
Reverse Mortgage Home Equity Conversion Mortgage
Purchase Details
Closed on
May 23, 2012
Sold by
Kami Barry T and Kami Cathy Jo
Bought by
Kami Barry G and Kami Cathy Jo
Purchase Details
Closed on
Mar 28, 1994
Sold by
Woodson Letitia Y
Bought by
Woodson Letitia W
Create a Home Valuation Report for This Property
The Home Valuation Report is an in-depth analysis detailing your home's value as well as a comparison with similar homes in the area
Home Values in the Area
Average Home Value in this Area
Purchase History
| Date | Buyer | Sale Price | Title Company |
|---|---|---|---|
| Woodson Letitia Y | -- | Fnc Title Services Llc | |
| Woodson Letitia Y | -- | None Available | |
| Kami Barry G | -- | None Available | |
| Woodson Letitia W | -- | -- |
Source: Public Records
Mortgage History
| Date | Status | Borrower | Loan Amount |
|---|---|---|---|
| Open | Woodson Letitia Y | $1,680,000 | |
| Closed | Woodson Letitia Y | $938,250 |
Source: Public Records
Tax History
| Year | Tax Paid | Tax Assessment Tax Assessment Total Assessment is a certain percentage of the fair market value that is determined by local assessors to be the total taxable value of land and additions on the property. | Land | Improvement |
|---|---|---|---|---|
| 2025 | $5,116 | $76,382 | $35,050 | $48,332 |
| 2024 | $5,116 | $74,747 | $34,363 | $47,384 |
| 2023 | $4,925 | $80,144 | $33,689 | $46,455 |
| 2022 | $5,002 | $71,573 | $33,029 | $45,544 |
| 2021 | $4,358 | $70,032 | $32,381 | $44,651 |
| 2020 | $3,979 | $76,242 | $32,049 | $44,193 |
| 2019 | $3,652 | $74,748 | $31,421 | $43,327 |
| 2018 | $3,535 | $73,283 | $30,805 | $42,478 |
| 2017 | $3,378 | $71,846 | $30,201 | $41,645 |
| 2016 | $3,137 | $70,437 | $29,609 | $40,828 |
| 2015 | $3,068 | $69,379 | $29,164 | $40,215 |
| 2014 | $2,986 | $68,020 | $28,593 | $39,427 |
Source: Public Records
Map
Nearby Homes
- 2218 -2222 Grant St
- 2015 Delaware St
- 2015 Delaware St Unit A
- 1625 Martin Luther King jr Way
- 1808 Cedar St
- 2118 California St
- 1813 Sacramento St
- 1609 Bonita Ave Unit 5
- 1610 Milvia St
- 1436 Delaware St
- 1411 Hearst Ave Unit 2
- 1815 Vine St
- 1564 Sacramento St
- 1682 Oxford St
- 1425 Martin Luther King jr Way
- 2201 Virginia St Unit 2
- 1739 Spruce St
- 1444 Walnut St
- 1519 Oxford St Unit E
- 2350 Sacramento St
- 1907 Grant St
- 1915 Grant St
- 1905 Grant St
- 1917 Grant St
- 1811 Berkeley Way
- 1810 Hearst Ave
- 1901 Grant St
- 1919 Grant St
- 1813 Berkeley Way
- 1906 Grant St
- 1815 Berkeley Way
- 1904 Grant St
- 1817 Berkeley Way
- 1818 Hearst Ave
- 1736 Hearst Ave
- 1927 Grant St
- 1929 Grant St
- 1820 Hearst Ave Unit C
- 1820 Hearst Ave Unit A
- 1734 Hearst Ave Unit 2
Your Personal Tour Guide
Ask me questions while you tour the home.