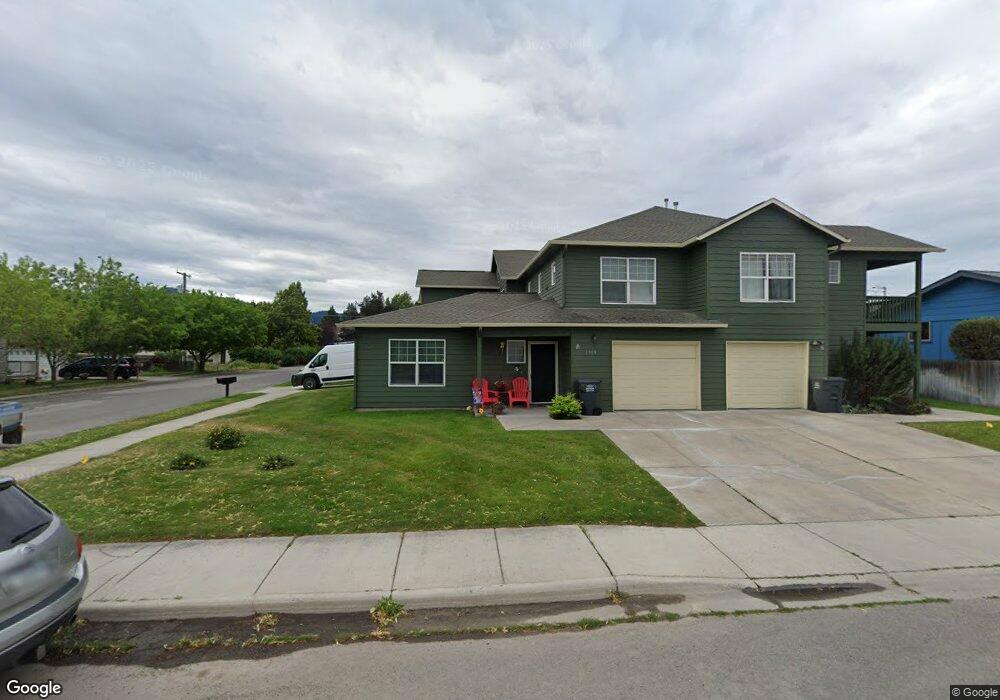
1909 Idaho St Unit D Missoula, MT 59801
River Road NeighborhoodEstimated Value: $366,000 - $410,912
3
Beds
3
Baths
1,526
Sq Ft
$252/Sq Ft
Est. Value
About This Home
This home is located at 1909 Idaho St Unit D, Missoula, MT 59801 and is currently estimated at $384,304, approximately $251 per square foot. 1909 Idaho St Unit D is a home located in Missoula County with nearby schools including Hawthorne Elementary School, Porter Middle School, and Big Sky High School.
Ownership History
Date
Name
Owned For
Owner Type
Purchase Details
Closed on
Sep 25, 2025
Sold by
Gehr Matthew K and Gehr Amber M
Bought by
Lee Lexi
Current Estimated Value
Home Financials for this Owner
Home Financials are based on the most recent Mortgage that was taken out on this home.
Original Mortgage
$110,625
Outstanding Balance
$110,625
Interest Rate
6.58%
Mortgage Type
New Conventional
Estimated Equity
$273,679
Purchase Details
Closed on
May 14, 2020
Sold by
Crowder Shayn
Bought by
Gehr Matthew K and Gehr Amber M
Home Financials for this Owner
Home Financials are based on the most recent Mortgage that was taken out on this home.
Original Mortgage
$208,050
Interest Rate
3.3%
Mortgage Type
New Conventional
Purchase Details
Closed on
Mar 13, 2020
Sold by
Crowder Dawn
Bought by
Crowder Shayn
Purchase Details
Closed on
Apr 12, 2018
Sold by
Martin Kaylene
Bought by
Crowder Dawn and Crowder Shayn
Purchase Details
Closed on
Nov 28, 2005
Sold by
Ault Emmett J and Rohde Joshua C
Bought by
Martin Kaylene
Home Financials for this Owner
Home Financials are based on the most recent Mortgage that was taken out on this home.
Original Mortgage
$151,250
Interest Rate
5.97%
Mortgage Type
Purchase Money Mortgage
Create a Home Valuation Report for This Property
The Home Valuation Report is an in-depth analysis detailing your home's value as well as a comparison with similar homes in the area
Home Values in the Area
Average Home Value in this Area
Purchase History
| Date | Buyer | Sale Price | Title Company |
|---|---|---|---|
| Lee Lexi | -- | Flying S Title And Escrow | |
| Gehr Matthew K | -- | Title Source Inc | |
| Crowder Shayn | -- | None Available | |
| Crowder Dawn | -- | Insured Titles Llc | |
| Martin Kaylene | -- | -- |
Source: Public Records
Mortgage History
| Date | Status | Borrower | Loan Amount |
|---|---|---|---|
| Open | Lee Lexi | $110,625 | |
| Previous Owner | Gehr Matthew K | $208,050 | |
| Previous Owner | Martin Kaylene | $151,250 |
Source: Public Records
Tax History Compared to Growth
Tax History
| Year | Tax Paid | Tax Assessment Tax Assessment Total Assessment is a certain percentage of the fair market value that is determined by local assessors to be the total taxable value of land and additions on the property. | Land | Improvement |
|---|---|---|---|---|
| 2025 | $3,849 | $393,600 | $170,000 | $223,600 |
| 2024 | $3,849 | $303,000 | $21,709 | $281,291 |
| 2023 | $3,559 | $303,000 | $21,709 | $281,291 |
| 2022 | $3,299 | $243,600 | $19,620 | $223,980 |
| 2021 | $2,960 | $243,600 | $0 | $0 |
| 2020 | $2,736 | $208,600 | $0 | $0 |
| 2019 | $2,726 | $208,600 | $0 | $0 |
| 2018 | $2,530 | $188,100 | $0 | $0 |
| 2017 | $1,993 | $150,600 | $0 | $0 |
| 2016 | $1,871 | $147,700 | $0 | $0 |
| 2015 | $1,730 | $147,700 | $0 | $0 |
| 2014 | $1,836 | $88,283 | $0 | $0 |
Source: Public Records
Map
Nearby Homes
- 1915 Montana St Unit I
- 1923 Montana St Unit B
- 1822 Wyoming St Unit G
- 215 N Garfield St Unit C
- 714 Skyla Ct Unit B
- 612 N Curtis St
- Lot 17B Block 6 Montana St
- Lot 3 Block 6 Montana St
- Lot 2 Block 6 Montana St
- Lot 1A Block 6 Montana St
- Lot 5 Block 3 Montana St
- Lot 4 Block 3 Montana St
- Lot 3 Block 3 Montana St
- Lot 2 Block 3 Montana St
- Lot 1 Block 3 Montana St
- 200 N Garfield St
- 145 S Russell St
- 2355 River Rd
- 2348 River Rd
- 2360 River Rd Unit 2
- 1909 Idaho St
- 1909 Idaho St Unit E
- 1909 Idaho St Unit C
- 1909 Idaho St Unit C
- 1909 Idaho St Unit A
- 1909 Idaho St Unit E
- 1905 Idaho St Unit B
- 323 N Grant St
- 1939 Idaho St
- 1935 Idaho St
- 324A N Grant St
- 324 A N Grant St
- 324 B N Grant St
- 324 N Grant St Unit B
- 324 N Grant St
- 324 N Grant St Unit a
- 1900 Montana St
- 1910 Montana St
- 1945 Idaho St Unit Lot 5, 6, 7
- 1945 Idaho St Unit Lot 5