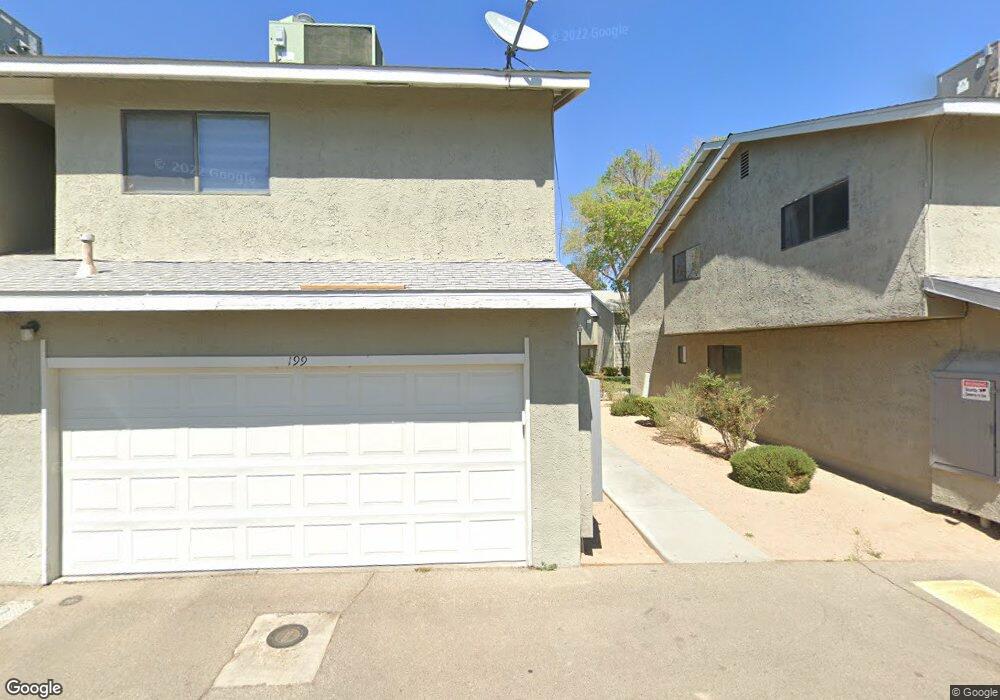
191 E Upjohn Ave Unit C Ridgecrest, CA 93555
Estimated Value: $194,000 - $221,132
4
Beds
3
Baths
568
Sq Ft
$373/Sq Ft
Est. Value
About This Home
This home is located at 191 E Upjohn Ave Unit C, Ridgecrest, CA 93555 and is currently estimated at $211,783, approximately $372 per square foot. 191 E Upjohn Ave Unit C is a home located in Kern County with nearby schools including Gateway Elementary School, Murray Middle School, and Burroughs High School.
Ownership History
Date
Name
Owned For
Owner Type
Purchase Details
Closed on
Sep 9, 2016
Sold by
Powers Edward Joseph and Powers Barbara Anne
Bought by
Jones Joshua
Current Estimated Value
Home Financials for this Owner
Home Financials are based on the most recent Mortgage that was taken out on this home.
Original Mortgage
$121,754
Outstanding Balance
$97,252
Interest Rate
3.43%
Estimated Equity
$114,531
Purchase Details
Closed on
Dec 9, 2005
Sold by
Haberman Joe R and Haberman Maryann
Bought by
Powers Edward Joseph
Purchase Details
Closed on
Jun 7, 1994
Sold by
Bankers Trust Company Of California Na
Bought by
Haberman Joe R
Home Financials for this Owner
Home Financials are based on the most recent Mortgage that was taken out on this home.
Original Mortgage
$39,200
Interest Rate
5.82%
Purchase Details
Closed on
Nov 30, 1993
Sold by
Professional Foreclosure Corp
Bought by
Bankers Trust Company Of California Na
Create a Home Valuation Report for This Property
The Home Valuation Report is an in-depth analysis detailing your home's value as well as a comparison with similar homes in the area
Home Values in the Area
Average Home Value in this Area
Purchase History
| Date | Buyer | Sale Price | Title Company |
|---|---|---|---|
| Jones Joshua | $124,000 | Placer Title Company | |
| Powers Edward Joseph | $32,500 | First American Title | |
| Haberman Joe R | $49,500 | World Title | |
| Bankers Trust Company Of California Na | $30,262 | Fidelity Title |
Source: Public Records
Mortgage History
| Date | Status | Borrower | Loan Amount |
|---|---|---|---|
| Open | Jones Joshua | $121,754 | |
| Previous Owner | Haberman Joe R | $39,200 |
Source: Public Records
Tax History
| Year | Tax Paid | Tax Assessment Tax Assessment Total Assessment is a certain percentage of the fair market value that is determined by local assessors to be the total taxable value of land and additions on the property. | Land | Improvement |
|---|---|---|---|---|
| 2025 | $2,063 | $143,907 | $11,603 | $132,304 |
| 2024 | $2,063 | $141,086 | $11,376 | $129,710 |
| 2023 | $2,003 | $138,320 | $11,153 | $127,167 |
| 2022 | $1,962 | $135,609 | $10,935 | $124,674 |
| 2021 | $1,893 | $132,951 | $10,721 | $122,230 |
| 2020 | $1,845 | $131,589 | $10,612 | $120,977 |
| 2019 | $1,817 | $131,589 | $10,612 | $120,977 |
| 2018 | $1,769 | $126,480 | $10,200 | $116,280 |
| 2017 | $1,764 | $124,000 | $10,000 | $114,000 |
| 2016 | $1,630 | $115,434 | $17,313 | $98,121 |
| 2015 | $1,606 | $113,701 | $17,053 | $96,648 |
| 2014 | $1,484 | $111,474 | $16,719 | $94,755 |
Source: Public Records
Map
Nearby Homes
- 189 E Upjohn Ave
- 179 E Upjohn Ave
- 269 E Upjohn Ave
- 609 S Sorrel St
- 325 E Wilson Ave
- 442 S Desert Candles St
- 313 Lenore St
- 216 E Cardigan Ave
- 118 W Wilson Ave
- 128 W Haloid Ave
- 700 S Silver Ridge St Unit 8
- 120 Parkview Ave
- 236 W Iowa Ave
- 204 W Robertson Rd
- 219 W Church Ave
- 223 W Church Ave
- 222 Church
- 384 E California Ave
- 604 E Wilson Ave
- 313 W Church Ave
- 193 E Upjohn Ave Unit C
- 177 E Upjohn Ave
- 197 E Upjohn Ave
- 175 E Upjohn Ave
- 173 E Upjohn Ave
- 199 E Upjohn Ave
- 0 Place 227 E Upjohn Ave
- 171 E Upjohn Ave
- 169 E Upjohn Ave
- 181 E Upjohn Ave
- 183 E Upjohn Ave Unit B
- 225 E Upjohn Ave
- 204 E Hayden Ave
- 185 E Upjohn Ave
- 167 E Upjohn Ave
- 187 E Upjohn Ave Unit B
- 200 E Hayden Ave
- 227 E Upjohn Ave
- 208 E Hayden Ave
- 229 E Upjohn Ave
Your Personal Tour Guide
Ask me questions while you tour the home.