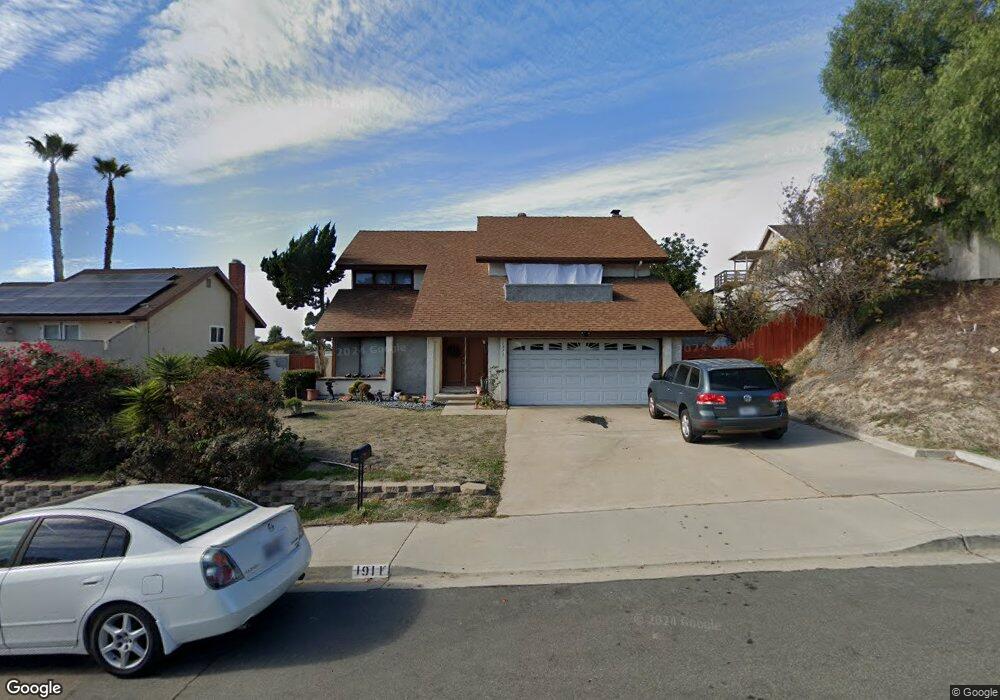
1911 Gotham St Chula Vista, CA 91913
Eastlake NeighborhoodEstimated Value: $915,000 - $941,000
4
Beds
3
Baths
1,838
Sq Ft
$503/Sq Ft
Est. Value
About This Home
This home is located at 1911 Gotham St, Chula Vista, CA 91913 and is currently estimated at $925,001, approximately $503 per square foot. 1911 Gotham St is a home located in San Diego County with nearby schools including Burton C. Tiffany Elementary School, Bonita Vista Middle School, and Bonita Vista Senior High School.
Ownership History
Date
Name
Owned For
Owner Type
Purchase Details
Closed on
Sep 27, 2001
Sold by
Holt Ricky L and Holt Cathy J
Bought by
Banouvong Kongphet
Current Estimated Value
Home Financials for this Owner
Home Financials are based on the most recent Mortgage that was taken out on this home.
Original Mortgage
$231,900
Outstanding Balance
$90,641
Interest Rate
6.87%
Estimated Equity
$834,360
Purchase Details
Closed on
Jun 7, 1999
Sold by
Hua Long Shu and Hua Joseph R
Bought by
Holt Ricky L and Holt Cathy J
Home Financials for this Owner
Home Financials are based on the most recent Mortgage that was taken out on this home.
Original Mortgage
$206,900
Interest Rate
6.87%
Purchase Details
Closed on
Jan 4, 1996
Sold by
Long Mark S
Bought by
Long Shu Hua
Purchase Details
Closed on
Mar 15, 1993
Create a Home Valuation Report for This Property
The Home Valuation Report is an in-depth analysis detailing your home's value as well as a comparison with similar homes in the area
Home Values in the Area
Average Home Value in this Area
Purchase History
| Date | Buyer | Sale Price | Title Company |
|---|---|---|---|
| Banouvong Kongphet | $290,000 | Equity Title | |
| Holt Ricky L | $230,000 | First American Title | |
| Long Shu Hua | -- | -- | |
| -- | $187,000 | -- |
Source: Public Records
Mortgage History
| Date | Status | Borrower | Loan Amount |
|---|---|---|---|
| Open | Banouvong Kongphet | $231,900 | |
| Previous Owner | Holt Ricky L | $206,900 |
Source: Public Records
Tax History Compared to Growth
Tax History
| Year | Tax Paid | Tax Assessment Tax Assessment Total Assessment is a certain percentage of the fair market value that is determined by local assessors to be the total taxable value of land and additions on the property. | Land | Improvement |
|---|---|---|---|---|
| 2025 | $4,870 | $428,244 | $169,600 | $258,644 |
| 2024 | $4,870 | $419,848 | $166,275 | $253,573 |
| 2023 | $4,802 | $411,616 | $163,015 | $248,601 |
| 2022 | $4,663 | $403,546 | $159,819 | $243,727 |
| 2021 | $4,554 | $395,635 | $156,686 | $238,949 |
| 2020 | $4,445 | $391,579 | $155,080 | $236,499 |
| 2019 | $4,329 | $383,902 | $152,040 | $231,862 |
| 2018 | $4,261 | $376,375 | $149,059 | $227,316 |
| 2017 | $4,171 | $368,996 | $146,137 | $222,859 |
| 2016 | $4,072 | $361,762 | $143,272 | $218,490 |
| 2015 | $4,013 | $356,329 | $141,120 | $215,209 |
| 2014 | $3,946 | $349,350 | $138,356 | $210,994 |
Source: Public Records
Map
Nearby Homes
- 1761 Harvard St
- 1925 Otay Lakes Rd Unit 69
- 1925 Otay Lakes Rd Unit 43
- 1925 Otay Lakes Rd Unit 39
- 1925 Otay Lakes Rd Unit 167
- 678 Rue Avallon
- 2015 Lakeridge Cir Unit 301
- 1665 Yale St
- 1654 Yale St
- 725 Brookstone Rd Unit 101
- 2083 Waterbury
- 749 Brookstone Rd Unit 101
- 731 Brookstone Rd Unit 103
- 2018 Bridgeport
- 2083 Lakeridge Cir Unit 104
- 773 Brookstone Rd Unit 304
- 761 Brookstone Rd Unit 203
- 609 Rue Bayonne
- 1579 Apache Dr Unit E
- 1567 Apache Dr Unit A
- 1901 Gotham St
- 844 Stanford Ave
- 840 Stanford Ave
- 1834 Carolyn Dr
- 836 Stanford Ave
- 853 Rutgers Ave
- 854 Stanford Ave
- 1832 Carolyn Dr
- 832 Stanford Ave
- 859 Rutgers Ave
- 858 Stanford Ave
- 843 Stanford Ave
- 839 Stanford Ave
- 1920 Gotham St
- 835 Stanford Ave
- 828 Stanford Ave
- 865 Rutgers Ave
- 1896 Gotham St
- 1833 Carolyn Dr
- 862 Stanford Ave