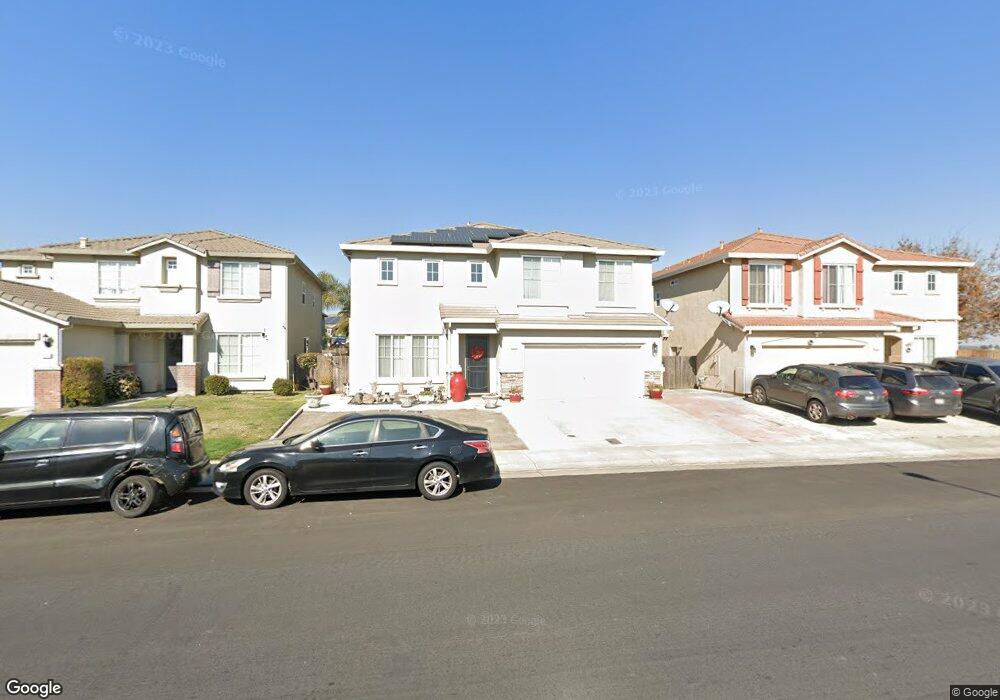
1911 Lonnie Beck Way Stockton, CA 95209
Spanos Park NeighborhoodEstimated Value: $575,000 - $693,000
5
Beds
3
Baths
2,848
Sq Ft
$222/Sq Ft
Est. Value
About This Home
This home is located at 1911 Lonnie Beck Way, Stockton, CA 95209 and is currently estimated at $633,665, approximately $222 per square foot. 1911 Lonnie Beck Way is a home located in San Joaquin County with nearby schools including John Muir Elementary School, Christa McAuliffe Middle School, and Bear Creek High School.
Ownership History
Date
Name
Owned For
Owner Type
Purchase Details
Closed on
Dec 31, 2013
Sold by
Valley Family Investors Llc
Bought by
Hu Albert J and Hu Kim O
Current Estimated Value
Home Financials for this Owner
Home Financials are based on the most recent Mortgage that was taken out on this home.
Original Mortgage
$300,257
Outstanding Balance
$224,749
Interest Rate
4.17%
Mortgage Type
FHA
Estimated Equity
$408,916
Purchase Details
Closed on
Oct 18, 2010
Sold by
Hsbc Bank Usa National Association
Bought by
Valley Family Investors Llc
Purchase Details
Closed on
Sep 10, 2010
Sold by
Verceles Onofre S and Verceles Lita G
Bought by
Hsbc Bank Usa National Association
Purchase Details
Closed on
Jun 19, 2006
Sold by
Woodside Tramore Inc
Bought by
Verceles Onofre S and Verceles Lita G
Home Financials for this Owner
Home Financials are based on the most recent Mortgage that was taken out on this home.
Original Mortgage
$429,600
Interest Rate
6.62%
Mortgage Type
Purchase Money Mortgage
Create a Home Valuation Report for This Property
The Home Valuation Report is an in-depth analysis detailing your home's value as well as a comparison with similar homes in the area
Home Values in the Area
Average Home Value in this Area
Purchase History
| Date | Buyer | Sale Price | Title Company |
|---|---|---|---|
| Hu Albert J | -- | Old Republic Title Company | |
| Valley Family Investors Llc | $230,000 | Chicago Title Company | |
| Hsbc Bank Usa National Association | $223,200 | None Available | |
| Verceles Onofre S | $537,500 | Placer Title Company |
Source: Public Records
Mortgage History
| Date | Status | Borrower | Loan Amount |
|---|---|---|---|
| Open | Hu Albert J | $300,257 | |
| Previous Owner | Verceles Onofre S | $429,600 |
Source: Public Records
Tax History Compared to Growth
Tax History
| Year | Tax Paid | Tax Assessment Tax Assessment Total Assessment is a certain percentage of the fair market value that is determined by local assessors to be the total taxable value of land and additions on the property. | Land | Improvement |
|---|---|---|---|---|
| 2025 | $5,123 | $374,854 | $131,197 | $243,657 |
| 2024 | $5,037 | $367,505 | $128,625 | $238,880 |
| 2023 | $4,993 | $360,300 | $126,103 | $234,197 |
| 2022 | $4,886 | $353,236 | $123,631 | $229,605 |
| 2021 | $4,963 | $346,310 | $121,207 | $225,103 |
| 2020 | $4,867 | $342,760 | $119,965 | $222,795 |
| 2019 | $4,732 | $336,040 | $117,613 | $218,427 |
| 2018 | $4,652 | $329,452 | $115,307 | $214,145 |
| 2017 | $4,524 | $322,994 | $113,047 | $209,947 |
| 2016 | $4,480 | $316,661 | $110,831 | $205,830 |
| 2014 | $3,640 | $240,273 | $59,572 | $180,701 |
Source: Public Records
Map
Nearby Homes
- 2120 Lonnie Beck Way
- 10647 Spring Creek Place
- 10622 Waterbury Dr
- 10628 Hidden Grove Cir
- 10242 Creek Trail Cir
- 10148 Tony Ct
- 10636 Elkhorn Dr
- 2630 Eagle Rock Cir
- 10014 River Bluff Ln
- 2140 Orvis Dr
- 1927 Gerber Dr
- 1146 Cypress Run Dr
- 712 Renoir Ln
- 1145 Hartwell Ave
- 647 Chagall Ln
- 3215 Golden Poppy Ln
- 10849 Iris Bloom Dr
- 10762 Pleasant Valley Cir
- 1903 Chaparral Way
- 10302 Bunker Ln
- 1917 Lonnie Beck Way
- 1905 Lonnie Beck Way
- 1908 Bright Star Place
- 1923 Lonnie Beck Way
- 1916 Bright Star Place
- 10910 Morning Star Place
- 1924 Bright Star Place
- 1929 Lonnie Beck Way
- 1914 Lonnie Beck Way
- 1906 Lonnie Beck Way
- 1932 Bright Star Place
- 1922 Lonnie Beck Way
- 10918 Morning Star Place
- 1935 Lonnie Beck Way
- 1930 Lonnie Beck Way
- 1940 Bright Star Place
- 10919 Morning Star Place
- 10926 Morning Star Place
- 1913 Autumn Oak Place
- 1941 Lonnie Beck Way