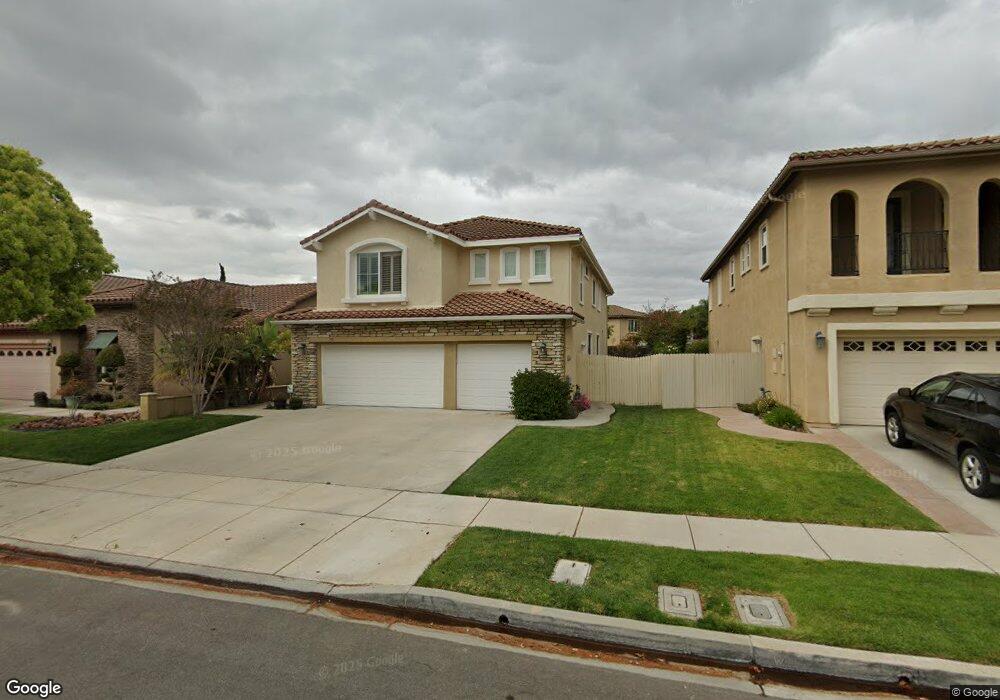
1911 Santo Domingo Camarillo, CA 93012
Estimated Value: $1,126,341 - $1,304,000
4
Beds
3
Baths
2,567
Sq Ft
$482/Sq Ft
Est. Value
About This Home
This home is located at 1911 Santo Domingo, Camarillo, CA 93012 and is currently estimated at $1,236,335, approximately $481 per square foot. 1911 Santo Domingo is a home located in Ventura County with nearby schools including La Mariposa Elementary School, Las Colinas Middle School, and Adolfo Camarillo High School.
Ownership History
Date
Name
Owned For
Owner Type
Purchase Details
Closed on
Oct 15, 2021
Sold by
Esses Jerry A
Bought by
Esses Jerry A and Esses Trust
Current Estimated Value
Purchase Details
Closed on
May 2, 2019
Sold by
Esses Jerry A
Bought by
Esses Jerry A and Templeman Angeline
Home Financials for this Owner
Home Financials are based on the most recent Mortgage that was taken out on this home.
Original Mortgage
$320,000
Outstanding Balance
$280,765
Interest Rate
4.2%
Mortgage Type
New Conventional
Estimated Equity
$955,570
Purchase Details
Closed on
Jul 31, 2002
Sold by
Pardee Homes
Bought by
Esses Jerry A
Home Financials for this Owner
Home Financials are based on the most recent Mortgage that was taken out on this home.
Original Mortgage
$390,343
Interest Rate
5.12%
Mortgage Type
Purchase Money Mortgage
Create a Home Valuation Report for This Property
The Home Valuation Report is an in-depth analysis detailing your home's value as well as a comparison with similar homes in the area
Home Values in the Area
Average Home Value in this Area
Purchase History
| Date | Buyer | Sale Price | Title Company |
|---|---|---|---|
| Esses Jerry A | -- | None Available | |
| Esses Jerry A | -- | Lawyers Title Spl | |
| Esses Jerry A | $489,500 | First American Title Ins Co |
Source: Public Records
Mortgage History
| Date | Status | Borrower | Loan Amount |
|---|---|---|---|
| Open | Esses Jerry A | $320,000 | |
| Previous Owner | Esses Jerry A | $390,343 |
Source: Public Records
Tax History Compared to Growth
Tax History
| Year | Tax Paid | Tax Assessment Tax Assessment Total Assessment is a certain percentage of the fair market value that is determined by local assessors to be the total taxable value of land and additions on the property. | Land | Improvement |
|---|---|---|---|---|
| 2025 | $7,775 | $708,706 | $283,480 | $425,226 |
| 2024 | $7,775 | $694,810 | $277,921 | $416,889 |
| 2023 | $7,496 | $681,187 | $272,472 | $408,715 |
| 2022 | $7,474 | $667,831 | $267,130 | $400,701 |
| 2021 | $7,206 | $654,737 | $261,892 | $392,845 |
| 2020 | $7,180 | $648,025 | $259,207 | $388,818 |
| 2019 | $7,148 | $635,320 | $254,125 | $381,195 |
| 2018 | $7,017 | $622,864 | $249,143 | $373,721 |
| 2017 | $6,603 | $610,652 | $244,258 | $366,394 |
| 2016 | $6,445 | $598,679 | $239,469 | $359,210 |
| 2015 | $6,378 | $589,688 | $235,873 | $353,815 |
| 2014 | $6,303 | $578,138 | $231,253 | $346,885 |
Source: Public Records
Map
Nearby Homes
- 2861 Via Descanso
- 2853 Via Descanso
- 2857 Via Descanso
- 2052 Santo Domingo
- 1631 Alta Vista Place
- 2854 Via Descanso
- 2860 Via Descanso
- 1492 Via Bonito
- 4532 Los Damascos Place
- 2255 Placita San Rufino
- 1431 Via Bonito
- 4030 Villamonte Ct
- 3623 Corona St
- 232 Talud Terrace Unit 19
- 2576 Villamonte Ct
- 135 Tranquila Dr Unit 61
- 210 Caleta Dr Unit 95
- 169 Tahquitz Dr Unit 188
- 14 Tahquitz Ct Unit 213
- 2420 Quartsite Dr
- 1929 Santo Domingo
- 1903 Santo Domingo
- 1897 Santo Domingo
- 1884 Padre Ln
- 1892 Padre Ln
- 4524 Calle Covina
- 4508 Calle Covina
- 4542 Calle Covina
- 1885 Santo Domingo
- 1876 Padre Ln
- 4558 Calle Covina
- 1926 Santo Domingo
- 1914 Santo Domingo
- 1932 Santo Domingo
- 1902 Santo Domingo
- 1899 Padre Ln
- 4574 Calle Covina
- 1868 Padre Ln
- 1877 Santo Domingo
- 1944 Santo Domingo