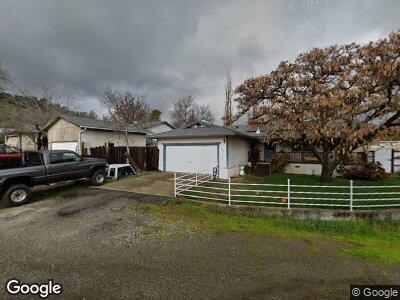
1911 Sugar Pine Way Vallecito, CA 95251
Estimated Value: $292,000 - $403,000
3
Beds
1
Bath
1,088
Sq Ft
$319/Sq Ft
Est. Value
About This Home
This home is located at 1911 Sugar Pine Way, Vallecito, CA 95251 and is currently estimated at $347,085, approximately $319 per square foot. 1911 Sugar Pine Way is a home located in Calaveras County with nearby schools including Bret Harte Union High School and Christian Heritage Academy.
Ownership History
Date
Name
Owned For
Owner Type
Purchase Details
Closed on
Mar 9, 2009
Sold by
Scott Linda Gail
Bought by
Padelford Phillip Edward
Current Estimated Value
Home Financials for this Owner
Home Financials are based on the most recent Mortgage that was taken out on this home.
Original Mortgage
$101,750
Outstanding Balance
$68,142
Interest Rate
5.19%
Mortgage Type
FHA
Estimated Equity
$305,132
Purchase Details
Closed on
Mar 4, 2009
Sold by
Padelford Phillip Edward
Bought by
Padelford William and Padelford Barbara
Home Financials for this Owner
Home Financials are based on the most recent Mortgage that was taken out on this home.
Original Mortgage
$101,750
Outstanding Balance
$68,142
Interest Rate
5.19%
Mortgage Type
FHA
Estimated Equity
$305,132
Purchase Details
Closed on
Sep 23, 2002
Sold by
Padelford Jonathan Eric
Bought by
Padelford Phillip Edward
Home Financials for this Owner
Home Financials are based on the most recent Mortgage that was taken out on this home.
Original Mortgage
$71,500
Interest Rate
6.16%
Create a Home Valuation Report for This Property
The Home Valuation Report is an in-depth analysis detailing your home's value as well as a comparison with similar homes in the area
Home Values in the Area
Average Home Value in this Area
Purchase History
| Date | Buyer | Sale Price | Title Company |
|---|---|---|---|
| Padelford Phillip Edward | -- | First American Title Company | |
| Padelford William | $203,000 | First American Title Company | |
| Padelford Phillip Edward | $36,000 | The Sterling Title Co |
Source: Public Records
Mortgage History
| Date | Status | Borrower | Loan Amount |
|---|---|---|---|
| Open | Padelford Barbara | $8,816 | |
| Open | Padelford William | $101,750 | |
| Previous Owner | Padelford Phillip Edward | $71,500 |
Source: Public Records
Tax History Compared to Growth
Tax History
| Year | Tax Paid | Tax Assessment Tax Assessment Total Assessment is a certain percentage of the fair market value that is determined by local assessors to be the total taxable value of land and additions on the property. | Land | Improvement |
|---|---|---|---|---|
| 2023 | $2,213 | $120,848 | $37,008 | $83,840 |
| 2022 | $1,826 | $118,480 | $36,283 | $82,197 |
| 2021 | $1,833 | $116,158 | $35,572 | $80,586 |
| 2020 | $1,410 | $114,968 | $35,208 | $79,760 |
| 2019 | $1,395 | $112,715 | $34,518 | $78,197 |
| 2018 | $1,362 | $110,506 | $33,842 | $76,664 |
| 2017 | $1,328 | $108,340 | $33,179 | $75,161 |
| 2016 | $1,112 | $87,000 | $25,000 | $62,000 |
| 2015 | -- | $87,000 | $25,000 | $62,000 |
| 2014 | -- | $87,000 | $25,000 | $62,000 |
Source: Public Records
Map
Nearby Homes
- 3135 Ponderosa Way
- 4205 Hwy 4
- 51 Canterwood Ln
- 4905 Moaning Cave Rd
- 386 Buckthorn Dr
- 249 Rome Ct
- 731 Dogwood Dr
- 1216 Ansil Davis Rd
- 0 Airola Rd Unit 224021350
- 0 Airola Rd Unit 202400301
- 233 Pyshon Rd
- 788 Pennsylvania Gulch Rd
- 3685 Angels Rd
- 1500 Vineyard Terrace Ct
- 21 Burrows Ln
- 193 Pennsylvania Gulch Rd
- 3651 Main St
- 4045 Red Hill Rd
- 1333 Vineyard Terrace Ct
- 57 Ernest St