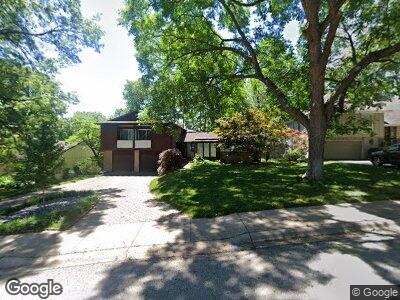
1911 W 70th Terrace Mission Hills, KS 66208
Estimated Value: $674,416 - $987,000
3
Beds
4
Baths
2,146
Sq Ft
$390/Sq Ft
Est. Value
About This Home
This home is located at 1911 W 70th Terrace, Mission Hills, KS 66208 and is currently estimated at $837,604, approximately $390 per square foot. 1911 W 70th Terrace is a home located in Johnson County with nearby schools including Belinder Elementary School, Indian Hills Middle School, and Shawnee Mission East High School.
Ownership History
Date
Name
Owned For
Owner Type
Purchase Details
Closed on
Jul 27, 2004
Sold by
Cohen Mark and Cohen Gabrielle
Bought by
Gasper Anthony M and Schwartz Rachel E
Current Estimated Value
Home Financials for this Owner
Home Financials are based on the most recent Mortgage that was taken out on this home.
Original Mortgage
$308,000
Interest Rate
6.3%
Mortgage Type
Purchase Money Mortgage
Purchase Details
Closed on
Apr 24, 2002
Sold by
Harden William Kevin and Harden Brenda J
Bought by
Cohen Mark and Cohen Gabrielle
Home Financials for this Owner
Home Financials are based on the most recent Mortgage that was taken out on this home.
Original Mortgage
$276,000
Interest Rate
7.09%
Create a Home Valuation Report for This Property
The Home Valuation Report is an in-depth analysis detailing your home's value as well as a comparison with similar homes in the area
Home Values in the Area
Average Home Value in this Area
Purchase History
| Date | Buyer | Sale Price | Title Company |
|---|---|---|---|
| Gasper Anthony M | -- | Security Land Title Company | |
| Cohen Mark | -- | Old Republic Title |
Source: Public Records
Mortgage History
| Date | Status | Borrower | Loan Amount |
|---|---|---|---|
| Open | Schwartz Rachel E | $361,200 | |
| Closed | Schwartz Rachel E | $374,200 | |
| Closed | Schwartz Rachel E | $384,000 | |
| Closed | Schwartz Rachel E | $417,000 | |
| Closed | Schwartz Rachel E | $416,400 | |
| Closed | Schwartz Rachel E | $417,000 | |
| Closed | Schwartz Rachel E | $100,000 | |
| Closed | Gasper Anthony M | $308,000 | |
| Previous Owner | Cohen Mark | $276,000 |
Source: Public Records
Tax History Compared to Growth
Tax History
| Year | Tax Paid | Tax Assessment Tax Assessment Total Assessment is a certain percentage of the fair market value that is determined by local assessors to be the total taxable value of land and additions on the property. | Land | Improvement |
|---|---|---|---|---|
| 2024 | $8,351 | $70,196 | $45,972 | $24,224 |
| 2023 | $7,308 | $60,847 | $33,431 | $27,416 |
| 2022 | $6,697 | $55,718 | $33,431 | $22,287 |
| 2021 | $6,989 | $55,901 | $30,393 | $25,508 |
| 2020 | $6,765 | $53,429 | $30,393 | $23,036 |
| 2019 | $6,736 | $52,980 | $27,631 | $25,349 |
| 2018 | $6,284 | $51,497 | $27,631 | $23,866 |
| 2017 | $6,326 | $51,083 | $27,631 | $23,452 |
| 2016 | $6,349 | $50,657 | $27,631 | $23,026 |
| 2015 | $6,152 | $47,461 | $27,638 | $19,823 |
| 2013 | -- | $48,427 | $27,638 | $20,789 |
Source: Public Records
Map
Nearby Homes
- 2114 W 71st St
- 1275 W Gregory Blvd
- 2207 W 71st St
- 1911 Romany Rd
- 1264 W 71st Terrace
- 2219 W 70th Terrace
- 1225 Romany Rd
- 2226 W 71st Terrace
- 2300 W 71st Terrace
- 1201 W 71st Terrace
- 1224 Arno Rd
- 1037 W Gregory Blvd
- 1232 W 69th St
- 1212 W 69th St
- 2014 W 74th St
- 2601 W 71st Terrace
- 1243 W 67th Terrace
- 7405 State Line Rd
- 7345 Mercier St
- 7345 Booth St
- 1911 W 70th Terrace
- 1919 W 70th Terrace
- 1903 W 70th Terrace
- 1906 W 71st St
- 2000 W 71st St
- 1900 W 71st St
- 1910 W 70th Terrace
- 1900 W 70th Terrace
- 2002 W 70th Terrace
- 2014 W 71st St
- 1241 W 70th Terrace
- 1290 W Gregory Blvd
- 2011 W 70th Terrace
- 1240 W 70th Terrace
- 1909 W 71st St
- 2020 W 71st St
- 2001 W 71st St
- 2010 W 70th Terrace
- 1901 W 71st St
- 2009 W 71st St