Estimated Value: $436,000 - $455,000
3
Beds
3
Baths
1,439
Sq Ft
$309/Sq Ft
Est. Value
About This Home
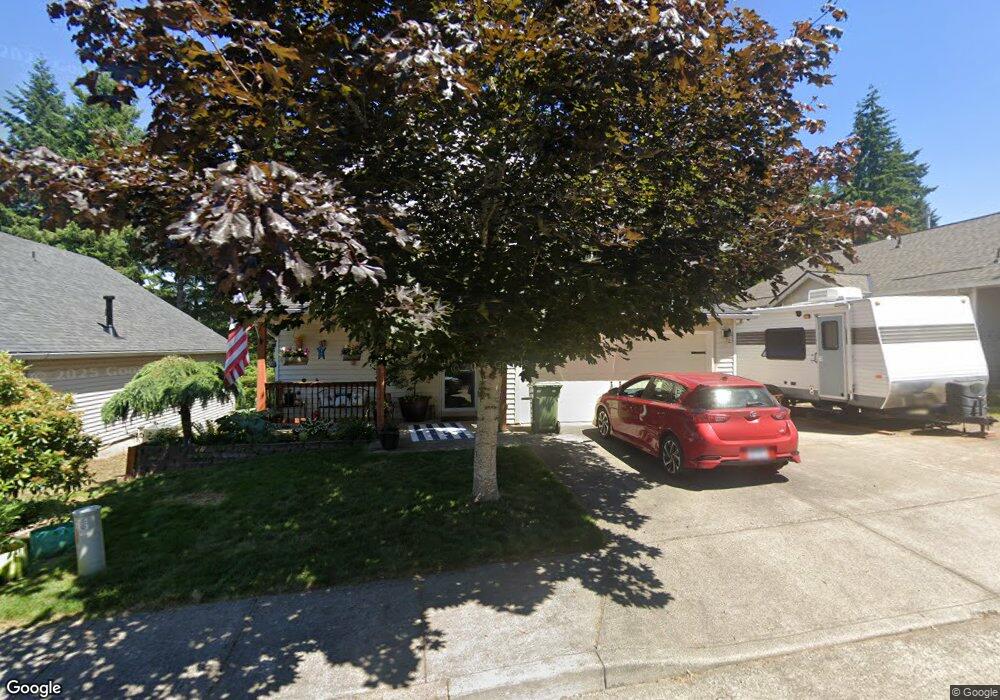
This home is located at 19118 Wallingford Ave, Sandy, OR 97055 and is currently estimated at $444,601, approximately $308 per square foot. 19118 Wallingford Ave is a home located in Clackamas County with nearby schools including Firwood Elementary School, Cedar Ridge Middle School, and Sandy High School.
Ownership History
Date
Name
Owned For
Owner Type
Purchase Details
Closed on
Sep 18, 2006
Sold by
Snider Michael L and Snider Dolores D
Bought by
Crawford Sandra and Crosby David
Current Estimated Value
Home Financials for this Owner
Home Financials are based on the most recent Mortgage that was taken out on this home.
Original Mortgage
$159,000
Outstanding Balance
$94,420
Interest Rate
6.56%
Mortgage Type
Purchase Money Mortgage
Estimated Equity
$350,181
Purchase Details
Closed on
Mar 25, 2005
Sold by
Boyer Gretchen L and Johnson Craig A
Bought by
Snider Michael L and Snider Dolores D
Home Financials for this Owner
Home Financials are based on the most recent Mortgage that was taken out on this home.
Original Mortgage
$140,000
Interest Rate
5.53%
Mortgage Type
VA
Purchase Details
Closed on
Jul 26, 2001
Sold by
Goldstar Homes Inc
Bought by
Boyer Gretchen L and Boyer Craig A
Home Financials for this Owner
Home Financials are based on the most recent Mortgage that was taken out on this home.
Original Mortgage
$147,390
Interest Rate
7.15%
Create a Home Valuation Report for This Property
The Home Valuation Report is an in-depth analysis detailing your home's value as well as a comparison with similar homes in the area
Home Values in the Area
Average Home Value in this Area
Purchase History
| Date | Buyer | Sale Price | Title Company |
|---|---|---|---|
| Crawford Sandra | $239,000 | Transnation Title Agency Or | |
| Snider Michael L | $177,900 | Transnation Title Agency Or | |
| Boyer Gretchen L | $151,950 | Chicago Title Insurance Co |
Source: Public Records
Mortgage History
| Date | Status | Borrower | Loan Amount |
|---|---|---|---|
| Open | Crawford Sandra | $159,000 | |
| Previous Owner | Snider Michael L | $140,000 | |
| Previous Owner | Boyer Gretchen L | $147,390 |
Source: Public Records
Tax History
| Year | Tax Paid | Tax Assessment Tax Assessment Total Assessment is a certain percentage of the fair market value that is determined by local assessors to be the total taxable value of land and additions on the property. | Land | Improvement |
|---|---|---|---|---|
| 2025 | $3,996 | $232,913 | -- | -- |
| 2024 | $3,828 | $226,130 | -- | -- |
| 2023 | $3,828 | $219,544 | $0 | $0 |
| 2022 | $3,626 | $213,150 | $0 | $0 |
| 2021 | $3,501 | $206,942 | $0 | $0 |
| 2020 | $3,406 | $200,915 | $0 | $0 |
| 2019 | $3,374 | $195,064 | $0 | $0 |
| 2018 | $3,279 | $189,383 | $0 | $0 |
| 2017 | $3,200 | $183,867 | $0 | $0 |
| 2016 | $3,090 | $178,512 | $0 | $0 |
Source: Public Records
Map
Nearby Homes
- 0 SE Jacoby Rd Unit 800
- 39302 Stratford Place
- 39329 Woodbury Way
- 39307 Woodbury Way
- 39576 Trillium St
- 18712 Cloud Cap Ave
- 38802 Cascadia Village Dr
- 39784 Syblon Ln
- 38573 Cascadia Village Dr
- 38581 Limerick St
- 40192 Laurel St
- 38408 Juniper St
- 18462 SE Langensand Rd
- 19135 SE Village Blvd
- 38915 Sandy Heights St
- 38249 Mulberry St
- 19115 Cork Ave
- 18050 SE Langensand Rd
- 18052 Seaman St
- 38510 Bickford St
- 19100 Wallingford Ave
- 19132 Wallingford Ave
- 39362 Stratford Place
- 19086 Wallingford Ave
- 19144 Wallingford Ave
- 39359 Newton St
- 39322 Stratford Place
- 19068 Wallingford Ave
- 39337 Newton St
- 0 SE Jacoby Rd
- 39311 SE Stratford St
- 39311 Stratford Place
- 39398 Amherst St
- 19040 Wallingford Ave
- 39315 Newton St
- 39340 Woodbury Way
- 39340 Woodbury St
- 39299 Stratford St
- 39288 Stratford Place
- 39299 Stratford Place
Your Personal Tour Guide
Ask me questions while you tour the home.