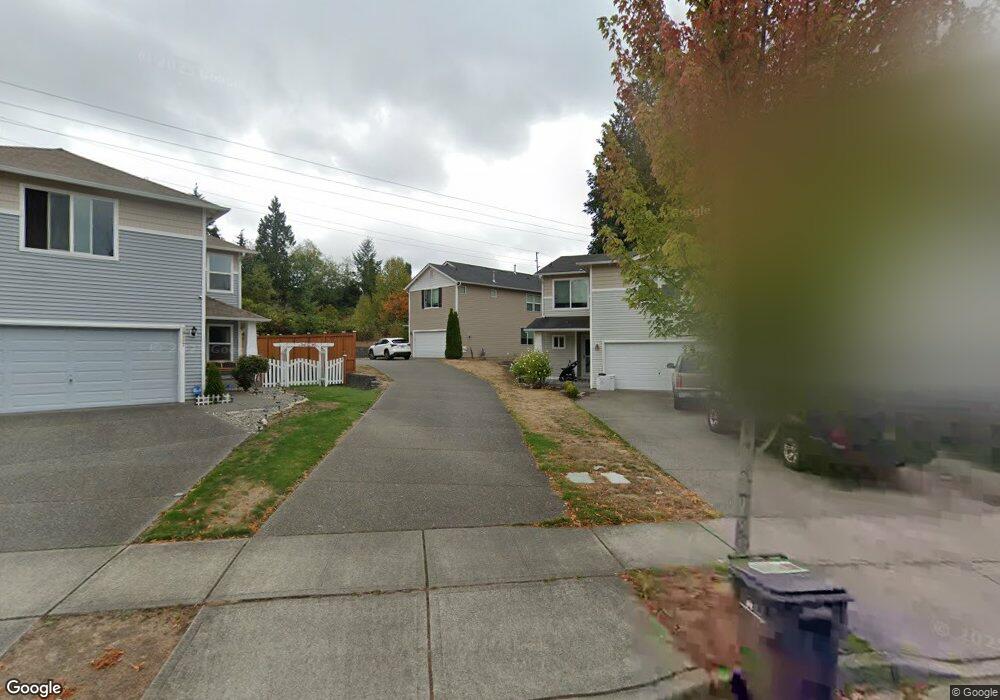
19119 14th Dr SE Bothell, WA 98012
North Creek NeighborhoodEstimated Value: $1,021,000 - $1,138,422
3
Beds
3
Baths
2,582
Sq Ft
$417/Sq Ft
Est. Value
About This Home
This home is located at 19119 14th Dr SE, Bothell, WA 98012 and is currently estimated at $1,076,106, approximately $416 per square foot. 19119 14th Dr SE is a home located in Snohomish County with nearby schools including Cedar Wood Elementary School, Heatherwood Middle School, and Henry M. Jackson High School.
Ownership History
Date
Name
Owned For
Owner Type
Purchase Details
Closed on
Jun 14, 2013
Sold by
Murphy Colin G
Bought by
Murphy Colin G and Juang Ting Zu
Current Estimated Value
Home Financials for this Owner
Home Financials are based on the most recent Mortgage that was taken out on this home.
Original Mortgage
$231,000
Outstanding Balance
$141,332
Interest Rate
3.32%
Mortgage Type
New Conventional
Estimated Equity
$934,774
Purchase Details
Closed on
Aug 20, 2010
Sold by
Blakely Donald J and Blakely Kristin
Bought by
Murphy Colin G
Home Financials for this Owner
Home Financials are based on the most recent Mortgage that was taken out on this home.
Original Mortgage
$239,800
Interest Rate
4.52%
Mortgage Type
New Conventional
Purchase Details
Closed on
Sep 10, 2007
Sold by
The Quadrant Corp
Bought by
Blakely Donald J and Blakely Kristin
Home Financials for this Owner
Home Financials are based on the most recent Mortgage that was taken out on this home.
Original Mortgage
$99,301
Interest Rate
6.67%
Mortgage Type
Credit Line Revolving
Create a Home Valuation Report for This Property
The Home Valuation Report is an in-depth analysis detailing your home's value as well as a comparison with similar homes in the area
Home Values in the Area
Average Home Value in this Area
Purchase History
| Date | Buyer | Sale Price | Title Company |
|---|---|---|---|
| Murphy Colin G | -- | Nextitle | |
| Murphy Colin G | $300,280 | Pnwt | |
| Blakely Donald J | $496,508 | Stewart |
Source: Public Records
Mortgage History
| Date | Status | Borrower | Loan Amount |
|---|---|---|---|
| Open | Murphy Colin G | $231,000 | |
| Closed | Murphy Colin G | $239,800 | |
| Previous Owner | Blakely Donald J | $99,301 | |
| Previous Owner | Blakely Donald J | $397,206 |
Source: Public Records
Tax History
| Year | Tax Paid | Tax Assessment Tax Assessment Total Assessment is a certain percentage of the fair market value that is determined by local assessors to be the total taxable value of land and additions on the property. | Land | Improvement |
|---|---|---|---|---|
| 2025 | $8,734 | $952,600 | $628,400 | $324,200 |
| 2024 | $8,734 | $911,400 | $598,500 | $312,900 |
| 2023 | $8,890 | $1,016,900 | $657,000 | $359,900 |
| 2022 | $6,981 | $689,800 | $353,700 | $336,100 |
| 2020 | $6,911 | $574,200 | $273,200 | $301,000 |
| 2019 | $6,374 | $531,000 | $232,800 | $298,200 |
| 2018 | $5,989 | $454,200 | $188,100 | $266,100 |
| 2017 | $5,020 | $382,500 | $166,300 | $216,200 |
| 2016 | $4,461 | $357,000 | $147,300 | $209,700 |
Source: Public Records
Map
Nearby Homes
- 18930 Bothell Everett Hwy Unit D203
- 18930 Bothell Everett Hwy Unit G103
- 1332 192nd St SE Unit 50
- 1332 192nd St SE Unit 44
- 1729 194th St SE Unit 19
- 1322 194th St SE Unit B4
- 1322 194th St SE Unit B7
- 1322 194th St SE Unit B2
- 1322 194th St SE Unit B1
- 1322 194th St SE Unit B6
- 18719 12th Dr SE
- 1402 194th St SE Unit 1
- 19102 20th Dr SE Unit B204
- 19102 20th Dr SE Unit B202
- 19102 20th Dr SE Unit B206
- 18809 20th Dr SE
- 2009 196th St SE Unit C103
- 525 192nd Place SE
- 1216 199th St SE
- 603 194th Place SE
- 19121 14th Dr SE
- 19117 14th Dr SE
- 19123 14th Dr SE
- 19115 14th Dr SE
- 19125 14th Dr SE
- 19111 16th Ave SE
- 19109 16th Ave SE
- 19113 14th Dr SE
- 1428 191st Place SE
- 1417 191st Place SE
- 19105 16th Ave SE
- 19105 16th Ave SE Unit 6
- 19114 14th Dr SE
- 19111 14th Dr SE
- 19117 16th Ave SE
- 1411 191st Place SE
- 1424 191st Place SE
- 19112 14th Dr SE
- 19108 16th Ave SE
- 19125 16th Ave SE
Your Personal Tour Guide
Ask me questions while you tour the home.