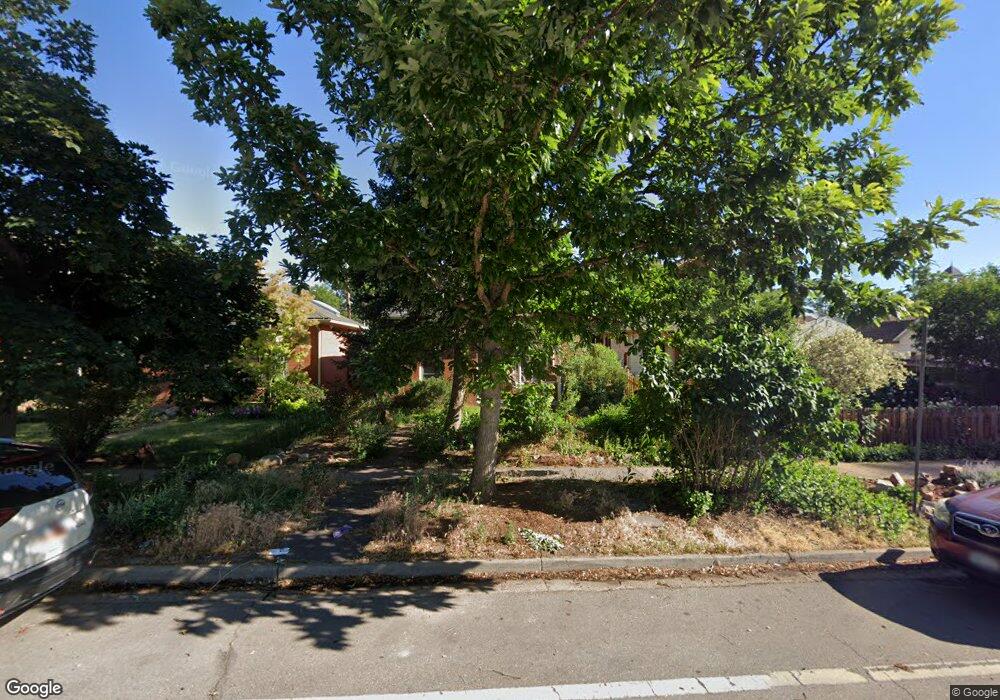
1913 Spruce St Boulder, CO 80302
Whittier NeighborhoodEstimated Value: $904,355 - $1,113,000
2
Beds
1
Bath
908
Sq Ft
$1,086/Sq Ft
Est. Value
About This Home
This home is located at 1913 Spruce St, Boulder, CO 80302 and is currently estimated at $985,839, approximately $1,085 per square foot. 1913 Spruce St is a home located in Boulder County with nearby schools including Whittier Elementary School, Casey Middle School, and Boulder High School.
Ownership History
Date
Name
Owned For
Owner Type
Purchase Details
Closed on
Aug 30, 2012
Sold by
Wojczuk Niko P
Bought by
Wojczuk Niko P
Current Estimated Value
Home Financials for this Owner
Home Financials are based on the most recent Mortgage that was taken out on this home.
Original Mortgage
$186,000
Outstanding Balance
$30,760
Interest Rate
3.49%
Mortgage Type
New Conventional
Estimated Equity
$955,079
Purchase Details
Closed on
Nov 23, 1994
Sold by
Lenson Sarah
Bought by
Wojczuk Niko P
Purchase Details
Closed on
Dec 7, 1983
Bought by
Wojczuk Niko P and Wojczuk Michael
Purchase Details
Closed on
May 5, 1981
Bought by
Wojczuk Niko P and Wojczuk Michael
Purchase Details
Closed on
Jun 29, 1976
Bought by
Wojczuk Niko P and Wojczuk Michael
Create a Home Valuation Report for This Property
The Home Valuation Report is an in-depth analysis detailing your home's value as well as a comparison with similar homes in the area
Home Values in the Area
Average Home Value in this Area
Purchase History
We collect this data history from publicly available records. To have your information removed, we recommend requesting removal directly through your county’s website.
| Date | Buyer | Sale Price | Title Company |
|---|---|---|---|
| Wojczuk Niko P | -- | Heritage Title | |
| Wojczuk Niko P | -- | -- | |
| Wojczuk Niko P | $83,500 | -- | |
| Wojczuk Niko P | $91,000 | -- | |
| Wojczuk Niko P | $30,000 | -- |
Source: Public Records
Mortgage History
We collect this data history from publicly available records. To have your information removed, we recommend requesting removal directly through your county’s website.
| Date | Status | Borrower | Loan Amount |
|---|---|---|---|
| Open | Wojczuk Niko P | $186,000 |
Source: Public Records
Tax History
| Year | Tax Paid | Tax Assessment Tax Assessment Total Assessment is a certain percentage of the fair market value that is determined by local assessors to be the total taxable value of land and additions on the property. | Land | Improvement |
|---|---|---|---|---|
| 2025 | $5,232 | $66,504 | $55,325 | $11,179 |
| 2024 | $5,483 | $61,125 | $50,850 | $10,275 |
| 2023 | $5,388 | $69,090 | $58,397 | $14,378 |
| 2022 | $4,557 | $56,024 | $45,578 | $10,446 |
| 2021 | $4,346 | $57,636 | $46,890 | $10,746 |
| 2020 | $3,840 | $51,266 | $40,183 | $11,083 |
| 2019 | $3,781 | $51,266 | $40,183 | $11,083 |
| 2018 | $3,532 | $47,938 | $30,816 | $17,122 |
| 2017 | $3,421 | $52,998 | $34,069 | $18,929 |
| 2016 | $3,279 | $45,842 | $26,905 | $18,937 |
| 2015 | $3,105 | $35,160 | $16,000 | $19,160 |
| 2014 | $2,287 | $35,160 | $16,000 | $19,160 |
Source: Public Records
Map
Nearby Homes
- 1938 Spruce St
- 2215 20th St
- 1989 19th St Unit C
- 2230 20th St
- 1843 Walnut St Unit B
- 2236 17th St
- 2034 Pearl St Unit 200
- 2324 19th St
- 1707 Walnut St Unit 307
- 1707 Walnut St Unit 208
- 1707 Walnut St Unit 308
- 1707 Walnut St Unit 101
- 1707 Walnut St Unit 103
- 1707 Walnut St Unit 207
- 1707 Walnut St Unit 206
- 1707 Walnut St Unit 202
- 1730 Bluff St
- 2116 Pearl St Unit C
- 1812 17th St Unit 101S
- 1750 Sunset Blvd
- 1837 Spruce St
- 1829 Spruce St
- 1831 Spruce St
- 1901 Spruce St
- 2120 19th St
- 1909 Spruce St
- 1844 Pine St
- 1838 Pine St
- 1840 Spruce St Unit B
- 1840 Spruce St Unit A
- 1840 Spruce St
- 1840 Spruce St Unit A & B
- 1842 Spruce St Unit A
- 1842 Spruce St Unit B
- 1842 Spruce St
- 1832 Spruce St Unit 4
- 1832 Spruce St Unit 3
- 1832 Spruce St Unit 2
- 1832 Spruce St Unit 1
- 1832 Spruce St
Your Personal Tour Guide
Ask me questions while you tour the home.