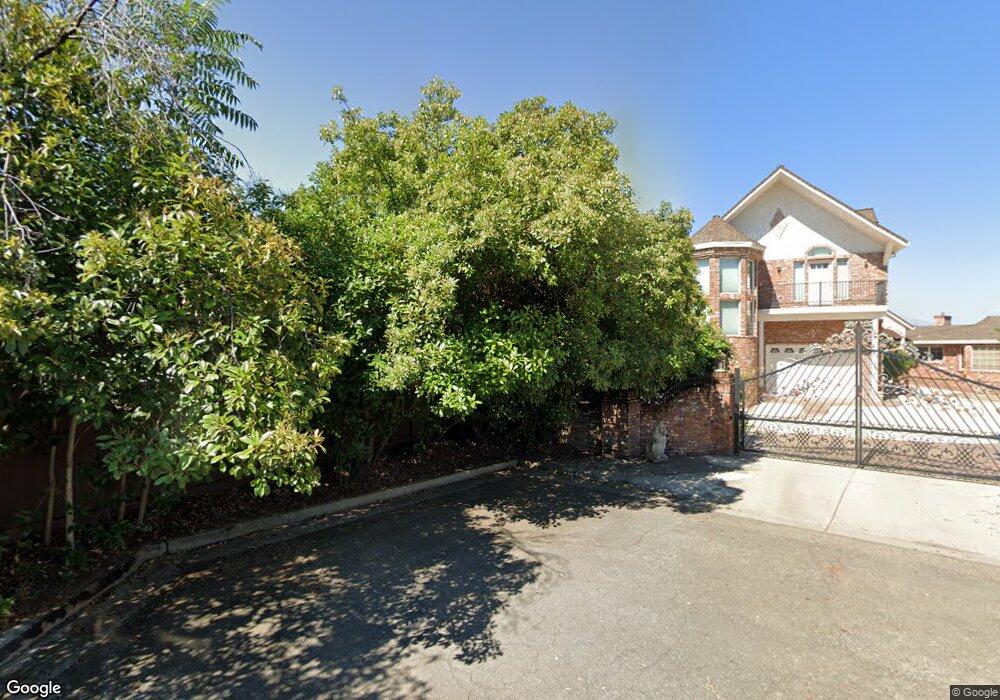
1914 Bechelli Ln Redding, CA 96002
Estimated Value: $353,000 - $419,000
3
Beds
3
Baths
1,794
Sq Ft
$210/Sq Ft
Est. Value
About This Home
This home is located at 1914 Bechelli Ln, Redding, CA 96002 and is currently estimated at $376,895, approximately $210 per square foot. 1914 Bechelli Ln is a home located in Shasta County with nearby schools including Rother Elementary School, Parsons Junior High School, and Enterprise High School.
Ownership History
Date
Name
Owned For
Owner Type
Purchase Details
Closed on
Jun 1, 2020
Sold by
Jones Christopher H and Jones Christine M
Bought by
Dodd Francis and The Francis Dodd Trust
Current Estimated Value
Purchase Details
Closed on
Nov 1, 2016
Sold by
Jones Christopher H and Jones Christine M
Bought by
Jones Christopher H and Jones Christine M
Purchase Details
Closed on
Jun 29, 2004
Sold by
Dynan Launa
Bought by
Jones Christopher H and Jones Christine M
Home Financials for this Owner
Home Financials are based on the most recent Mortgage that was taken out on this home.
Original Mortgage
$240,000
Interest Rate
5.75%
Mortgage Type
Purchase Money Mortgage
Purchase Details
Closed on
Nov 30, 2001
Sold by
Henderson Robert D and Henderson Nona G
Bought by
Dynan Launa
Home Financials for this Owner
Home Financials are based on the most recent Mortgage that was taken out on this home.
Original Mortgage
$159,000
Interest Rate
6.67%
Mortgage Type
Seller Take Back
Create a Home Valuation Report for This Property
The Home Valuation Report is an in-depth analysis detailing your home's value as well as a comparison with similar homes in the area
Purchase History
| Date | Buyer | Sale Price | Title Company |
|---|---|---|---|
| Dodd Francis | $330,000 | Placer Title Company | |
| Jones Christopher H | -- | None Available | |
| Jones Christopher H | $300,000 | Fidelity Natl Title Co Of Ca | |
| Dynan Launa | $179,000 | Fidelity National Title Co |
Source: Public Records
Mortgage History
| Date | Status | Borrower | Loan Amount |
|---|---|---|---|
| Previous Owner | Jones Christopher H | $240,000 | |
| Previous Owner | Dynan Launa | $159,000 |
Source: Public Records
Tax History
| Year | Tax Paid | Tax Assessment Tax Assessment Total Assessment is a certain percentage of the fair market value that is determined by local assessors to be the total taxable value of land and additions on the property. | Land | Improvement |
|---|---|---|---|---|
| 2025 | $3,907 | $360,899 | $49,212 | $311,687 |
| 2024 | $3,853 | $353,824 | $48,248 | $305,576 |
| 2023 | $3,853 | $346,887 | $47,302 | $299,585 |
| 2022 | $3,744 | $340,086 | $46,375 | $293,711 |
| 2021 | $3,617 | $333,418 | $45,466 | $287,952 |
| 2020 | $3,277 | $300,000 | $50,000 | $250,000 |
| 2019 | $3,316 | $300,000 | $65,000 | $235,000 |
| 2018 | $3,122 | $280,000 | $65,000 | $215,000 |
| 2017 | $3,069 | $265,000 | $65,000 | $200,000 |
| 2016 | $2,435 | $220,000 | $60,000 | $160,000 |
| 2015 | $2,176 | $195,000 | $55,000 | $140,000 |
| 2014 | $2,148 | $190,000 | $50,000 | $140,000 |
Source: Public Records
Map
Nearby Homes
- 1968 Bechelli Ln
- 2284 Paris Ave
- 350 Park Marina Cir
- 2165 Paris Ave
- 2068 Park Marina Dr
- 2041 Athens Ave
- 2010 Athens Ave
- 632 South St
- 2056 Canal Dr
- 1026 Palisades Ave
- 2590 Henderson Rd
- 724 Oakhurst Trail
- 550 Parsons Dr
- 2239 Garden Ave
- 1285 Lancers Ln
- 1939 Cameo Ct
- 775 Stonebriar Trail
- 825 Mission Sierra Ct
- 918 Parsons Dr
- 856 Mission de Oro Dr
- 1913 Bechelli Ln
- 1915 Bechelli Ln
- 1916 Bechelli Ln
- 1917 Bechelli Ln Unit The Bluffs
- 1917 Bechelli Ln
- 1912 Bechelli Ln
- 1918 Bechelli Ln
- 1911 Bechelli Ln
- 1892 Crestmont Dr
- 1927 Bechelli Ln
- 1919 Bechelli Ln Unit SFR
- 1919 Bechelli Ln
- 1910 Bechelli Ln
- 1920 Bechelli Ln Unit 1
- 1920 Bechelli Ln
- 1909 Bechelli Ln
- 1928 Bechelli Ln
- 1908 Bechelli Ln
- 1929 Bechelli Ln
- 1921 Bechelli Ln
Your Personal Tour Guide
Ask me questions while you tour the home.