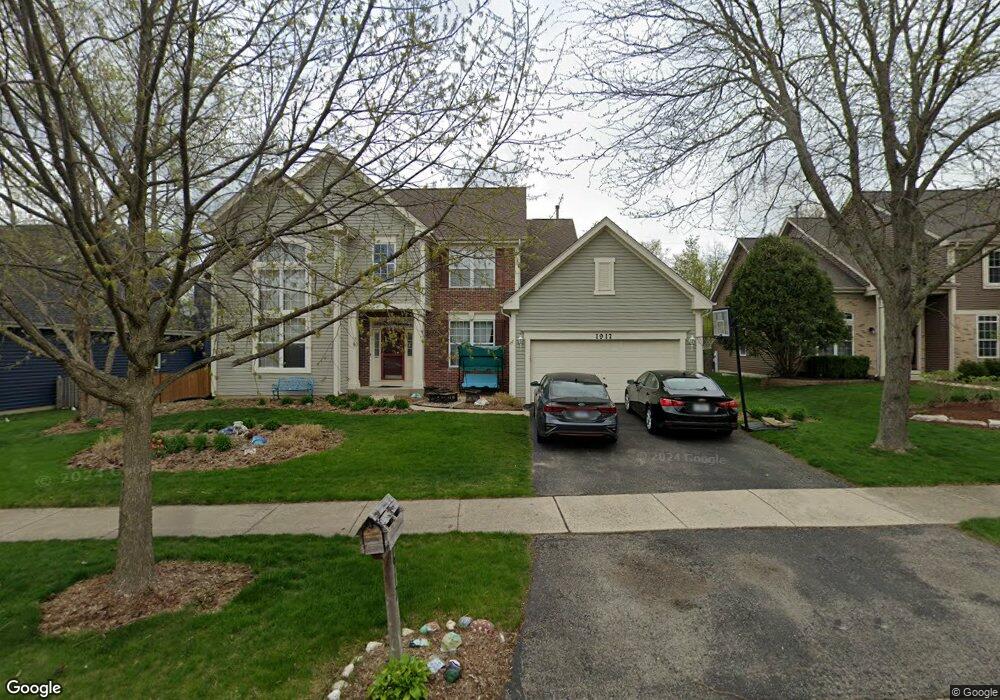
1917 Pinnacle Dr Aurora, IL 60502
Big Woods Marmion NeighborhoodEstimated Value: $465,482 - $506,000
4
Beds
--
Bath
2,552
Sq Ft
$190/Sq Ft
Est. Value
About This Home
This home is located at 1917 Pinnacle Dr, Aurora, IL 60502 and is currently estimated at $484,371, approximately $189 per square foot. 1917 Pinnacle Dr is a home located in Kane County with nearby schools including Louise White Elementary School, Sam Rotolo Middle School, and Batavia Sr High School.
Ownership History
Date
Name
Owned For
Owner Type
Purchase Details
Closed on
Mar 26, 2001
Sold by
Frank Jeffrey S and Frank Susan L
Bought by
Breytspraak Alan J and Breytspraak Nicole M
Current Estimated Value
Home Financials for this Owner
Home Financials are based on the most recent Mortgage that was taken out on this home.
Original Mortgage
$248,000
Outstanding Balance
$92,171
Interest Rate
7.13%
Estimated Equity
$392,200
Purchase Details
Closed on
Jun 18, 1999
Sold by
Wiseman Hughes Enterprises Inc
Bought by
Frank Jeffrey S and Frank Susan L
Home Financials for this Owner
Home Financials are based on the most recent Mortgage that was taken out on this home.
Original Mortgage
$212,900
Interest Rate
7.29%
Create a Home Valuation Report for This Property
The Home Valuation Report is an in-depth analysis detailing your home's value as well as a comparison with similar homes in the area
Home Values in the Area
Average Home Value in this Area
Purchase History
| Date | Buyer | Sale Price | Title Company |
|---|---|---|---|
| Breytspraak Alan J | $288,000 | Ticor Title Insurance | |
| Frank Jeffrey S | $258,000 | Chicago Title Insurance Co |
Source: Public Records
Mortgage History
| Date | Status | Borrower | Loan Amount |
|---|---|---|---|
| Open | Breytspraak Alan J | $248,000 | |
| Previous Owner | Frank Jeffrey S | $212,900 |
Source: Public Records
Tax History Compared to Growth
Tax History
| Year | Tax Paid | Tax Assessment Tax Assessment Total Assessment is a certain percentage of the fair market value that is determined by local assessors to be the total taxable value of land and additions on the property. | Land | Improvement |
|---|---|---|---|---|
| 2024 | $11,260 | $138,652 | $27,277 | $111,375 |
| 2023 | $11,135 | $125,842 | $24,757 | $101,085 |
| 2022 | $10,785 | $117,609 | $23,137 | $94,472 |
| 2021 | $10,413 | $111,541 | $21,943 | $89,598 |
| 2020 | $10,231 | $109,397 | $21,521 | $87,876 |
| 2019 | $10,086 | $105,524 | $20,759 | $84,765 |
| 2018 | $9,655 | $101,504 | $19,968 | $81,536 |
| 2017 | $9,471 | $98,157 | $19,310 | $78,847 |
| 2016 | $9,340 | $95,298 | $18,748 | $76,550 |
| 2015 | -- | $93,128 | $18,321 | $74,807 |
| 2014 | -- | $90,196 | $17,744 | $72,452 |
| 2013 | -- | $90,369 | $19,331 | $71,038 |
Source: Public Records
Map
Nearby Homes
- 2979 Arbor Ln
- 1639 Bentz Way
- 2271 Scott Ln Unit 5324
- 1580 Wind Energy Pass
- 2025 Gillenwater St
- 3S201 S Raddant Rd
- 2315 Nan St
- 3003 Abbey Cir
- 3075 Mesa Ln
- 3001 Abbey Cir
- 2634 Oakshire Ct
- 733 Wind Energy Pass
- 1332 Giese Rd Unit 2
- 1155 Hanover Dr
- 1342 Chillem Dr
- 1953 Charles Ln Unit 1953
- 1942 Tall Oaks Dr Unit 1A
- 1826 N Farnsworth Ave
- 1750 N Marywood Ave Unit 315
- 817 Woodland Hills Rd
- 1925 Pinnacle Dr
- 1909 Pinnacle Dr
- 1933 Pinnacle Dr
- 1901 Pinnacle Dr
- 1916 Pinnacle Dr
- 1924 Flagstone Ln
- 1924 Pinnacle Dr
- 1941 Pinnacle Dr
- 1893 Pinnacle Dr
- 1932 Pinnacle Dr
- 1910 Flagstone Ln
- 1948 Pinnacle Dr
- 1885 Pinnacle Dr
- 1896 Flagstone Ln
- 1943 Flagstone Ln Unit 1
- 1957 Pinnacle Dr
- 1882 Flagstone Ln
- 3178 Savannah Dr
- 3176 Savannah Dr Unit 2
- 3181 Savannah Dr