19173 Oak St Apple Valley, CA 92308
High Desert NeighborhoodEstimated Value: $282,000 - $300,000
2
Beds
2
Baths
1,332
Sq Ft
$217/Sq Ft
Est. Value
About This Home
This home is located at 19173 Oak St, Apple Valley, CA 92308 and is currently estimated at $289,577, approximately $217 per square foot. 19173 Oak St is a home located in San Bernardino County with nearby schools including Rio Vista School of Applied Learning, Apple Valley High School, and Mountain View Montessori Charter School.
Ownership History
Date
Name
Owned For
Owner Type
Purchase Details
Closed on
Apr 5, 2007
Sold by
Pless Bruce D
Bought by
Pless Bruce D and Pless Loranne
Current Estimated Value
Purchase Details
Closed on
Sep 1, 2000
Sold by
Pless Bruce D
Bought by
Pless Bruce D and Pless Loranne
Purchase Details
Closed on
Sep 15, 1998
Sold by
Smith Maynard W
Bought by
Pless Bruce D and Pless Loranne
Home Financials for this Owner
Home Financials are based on the most recent Mortgage that was taken out on this home.
Original Mortgage
$64,700
Outstanding Balance
$13,797
Interest Rate
6.88%
Estimated Equity
$275,780
Purchase Details
Closed on
Jan 11, 1996
Sold by
Watt Residential Partners
Bought by
Smith Maynard W and Smith Rita L
Home Financials for this Owner
Home Financials are based on the most recent Mortgage that was taken out on this home.
Original Mortgage
$67,200
Interest Rate
7.25%
Create a Home Valuation Report for This Property
The Home Valuation Report is an in-depth analysis detailing your home's value as well as a comparison with similar homes in the area
Home Values in the Area
Average Home Value in this Area
Purchase History
| Date | Buyer | Sale Price | Title Company |
|---|---|---|---|
| Pless Bruce D | -- | None Available | |
| Pless Bruce D | -- | -- | |
| Pless Bruce D | $115,000 | Chicago Title Co | |
| Smith Maynard W | $84,000 | Continental Lawyers Title Co |
Source: Public Records
Mortgage History
| Date | Status | Borrower | Loan Amount |
|---|---|---|---|
| Open | Pless Bruce D | $64,700 | |
| Previous Owner | Smith Maynard W | $67,200 |
Source: Public Records
Tax History Compared to Growth
Tax History
| Year | Tax Paid | Tax Assessment Tax Assessment Total Assessment is a certain percentage of the fair market value that is determined by local assessors to be the total taxable value of land and additions on the property. | Land | Improvement |
|---|---|---|---|---|
| 2025 | $2,036 | $179,818 | $36,058 | $143,760 |
| 2024 | $2,036 | $176,292 | $35,351 | $140,941 |
| 2023 | $2,016 | $172,835 | $34,658 | $138,177 |
| 2022 | $1,984 | $169,446 | $33,978 | $135,468 |
| 2021 | $1,937 | $166,124 | $33,312 | $132,812 |
| 2020 | $2,032 | $164,420 | $32,970 | $131,450 |
| 2019 | $1,996 | $161,197 | $32,324 | $128,873 |
| 2018 | $1,946 | $158,036 | $31,690 | $126,346 |
| 2017 | $1,917 | $154,938 | $31,069 | $123,869 |
| 2016 | $1,827 | $151,900 | $30,460 | $121,440 |
| 2015 | $1,799 | $149,618 | $30,002 | $119,616 |
| 2014 | $1,777 | $146,687 | $29,414 | $117,273 |
Source: Public Records
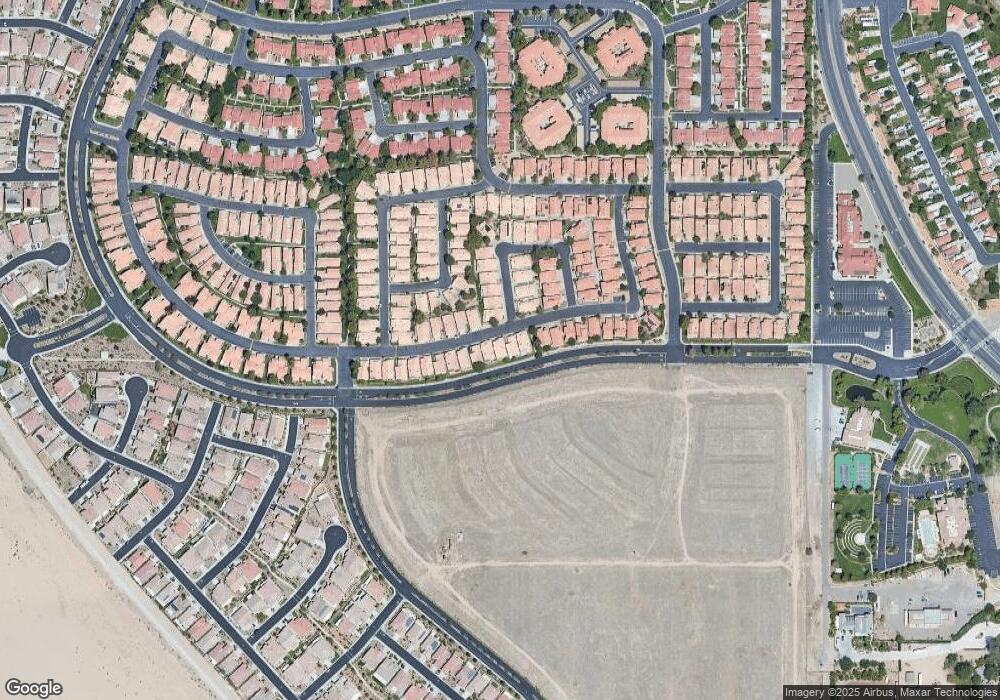
Map
Nearby Homes
- 19078 Stoddard Way
- 19229 Pine Way
- 19229 Palo Verde Dr
- 19058 Pamela Ln
- 19246 Pine Way
- 19135 Palo Verde Dr
- 19121 Palo Verde Dr Unit 14
- 19046 Stoddard Way
- 19163 Palo Verde Dr
- 11620 Locust Ln
- 19031 Pamela Ln
- 11548 Oak St
- 19014 Primrose Ln
- 0 Apple Valley Rd W
- 11704 Juniper Dr
- 11444 River Run St
- 11653 Pepper Ln
- 11580 Oak St
- 1 Clearview Dr
- 11584 Oak St
- 19169 Oak St
- 19177 Oak St
- 19145 Oak St
- 19181 Oak St
- 11528 Francisco Place
- 19139 Oak St
- 19146 Oak St
- 19142 Oak St
- 11534 Francisco Place
- 19133 Oak St
- 11525 Francisco Place
- 19136 Oak St
- 19189 Oak St
- 11542 Francisco Place
- 19127 Oak St
- 11535 Francisco Place
- 19128 Oak St
- 19133 Charlotte Place
- 11548 Francisco Place
- 11528 Sunset Place