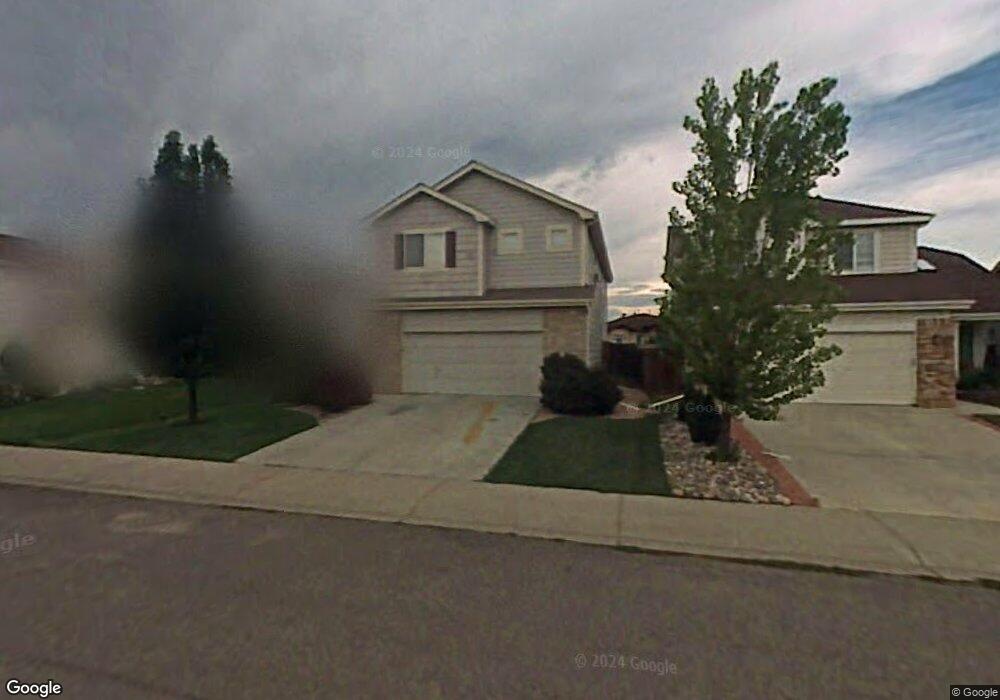
1918 Jamison Dr Fort Collins, CO 80528
Estimated Value: $514,611 - $537,000
3
Beds
3
Baths
1,898
Sq Ft
$278/Sq Ft
Est. Value
About This Home
This home is located at 1918 Jamison Dr, Fort Collins, CO 80528 and is currently estimated at $527,653, approximately $278 per square foot. 1918 Jamison Dr is a home located in Larimer County with nearby schools including Kruse Elementary School, Boltz Middle School, and Fort Collins High School.
Ownership History
Date
Name
Owned For
Owner Type
Purchase Details
Closed on
May 3, 2018
Sold by
Hoburg Erika
Bought by
Hoburg Andrew C
Current Estimated Value
Purchase Details
Closed on
Jan 27, 2011
Sold by
Hoburg Andrew C
Bought by
Hoburg Andrew C and Hoburg Erika
Home Financials for this Owner
Home Financials are based on the most recent Mortgage that was taken out on this home.
Original Mortgage
$158,000
Outstanding Balance
$108,423
Interest Rate
4.84%
Mortgage Type
New Conventional
Estimated Equity
$419,230
Purchase Details
Closed on
Nov 12, 1997
Sold by
U S Home Corp
Bought by
Hoburg Andrew C
Home Financials for this Owner
Home Financials are based on the most recent Mortgage that was taken out on this home.
Original Mortgage
$155,399
Interest Rate
7.23%
Mortgage Type
VA
Purchase Details
Closed on
Oct 1, 1994
Sold by
Richland Development Co Llc
Bought by
Gateway American Properties Llc
Purchase Details
Closed on
May 1, 1994
Sold by
Imago Enterprises Inc
Bought by
Richland Development Co Llc
Create a Home Valuation Report for This Property
The Home Valuation Report is an in-depth analysis detailing your home's value as well as a comparison with similar homes in the area
Home Values in the Area
Average Home Value in this Area
Purchase History
| Date | Buyer | Sale Price | Title Company |
|---|---|---|---|
| Hoburg Andrew C | -- | None Available | |
| Hoburg Andrew C | -- | Fidelity National Title Insu | |
| Hoburg Andrew C | $152,352 | Stewart Title | |
| Gateway American Properties Llc | $341,000 | -- | |
| Richland Development Co Llc | $758,800 | -- |
Source: Public Records
Mortgage History
| Date | Status | Borrower | Loan Amount |
|---|---|---|---|
| Open | Hoburg Andrew C | $158,000 | |
| Closed | Hoburg Andrew C | $155,399 |
Source: Public Records
Tax History Compared to Growth
Tax History
| Year | Tax Paid | Tax Assessment Tax Assessment Total Assessment is a certain percentage of the fair market value that is determined by local assessors to be the total taxable value of land and additions on the property. | Land | Improvement |
|---|---|---|---|---|
| 2025 | $3,225 | $37,292 | $3,015 | $34,277 |
| 2024 | $3,068 | $37,292 | $3,015 | $34,277 |
| 2022 | $2,592 | $27,446 | $3,128 | $24,318 |
| 2021 | $2,619 | $28,236 | $3,218 | $25,018 |
| 2020 | $2,790 | $29,816 | $3,218 | $26,598 |
| 2019 | $2,802 | $29,816 | $3,218 | $26,598 |
| 2018 | $2,121 | $23,270 | $3,240 | $20,030 |
| 2017 | $2,114 | $23,270 | $3,240 | $20,030 |
| 2016 | $1,985 | $21,739 | $3,582 | $18,157 |
| 2015 | $1,970 | $21,740 | $3,580 | $18,160 |
| 2014 | $1,709 | $18,730 | $3,580 | $15,150 |
Source: Public Records
Map
Nearby Homes
- 2055 Angelo Dr
- 2120 Timber Creek Dr Unit H4
- 2120 Timber Creek Dr Unit K1
- 5121 Stillwater Creek Dr Unit B
- 5225 White Willow Dr Unit F200
- 5225 White Willow Dr Unit N210
- 5225 White Willow Dr Unit J110
- 2138 Copper Creek Dr Unit B
- 2208 Copper Creek Dr Unit A
- 2107 Stillwater Creek Dr
- 2142 Stetson Creek Dr
- 2021 Timberline Ln
- 4913 Smallwood Ct
- 4751 Pleasant Oak Dr Unit C83
- 4751 Pleasant Oak Dr Unit C65
- 1715 Globe Ct
- 5502 Weeping Way
- 1313 Silk Oak Dr
- 4414 Monaco Place
- 5125 Redbud Ct
- 1924 Jamison Dr
- 1912 Jamison Dr
- 1906 Jamison Dr
- 1930 Jamison Dr
- 1936 Jamison Dr
- 1900 Jamison Dr
- 1919 Jamison Dr
- 1925 Jamison Dr
- 1913 Jamison Dr
- 4906 Wilmington Dr
- 1931 Jamison Dr
- 1942 Jamison Dr
- 1903 Wilmington Dr Unit 1
- 1903 Wilmington Dr
- 1903 Wilmington Dr Unit 102
- 1903 Wilmington Dr Unit 1
- 1937 Jamison Dr
- 4912 Wilmington Dr
- 1948 Jamison Dr
- 1906 Unity Ct