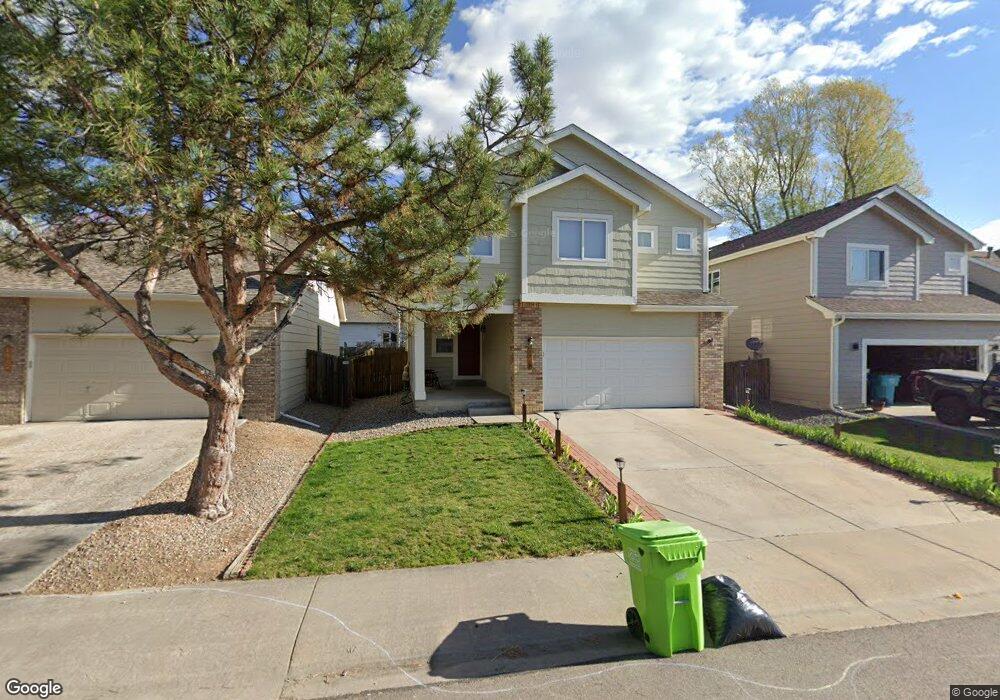
1918 Unity Ct Fort Collins, CO 80528
Estimated Value: $535,000 - $588,000
4
Beds
4
Baths
2,087
Sq Ft
$267/Sq Ft
Est. Value
About This Home
This home is located at 1918 Unity Ct, Fort Collins, CO 80528 and is currently estimated at $556,691, approximately $266 per square foot. 1918 Unity Ct is a home located in Larimer County with nearby schools including Kruse Elementary School, Boltz Middle School, and Fort Collins High School.
Ownership History
Date
Name
Owned For
Owner Type
Purchase Details
Closed on
Oct 10, 2007
Sold by
Mui Kwan Cheung and Ngai Hau Shim Mui
Bought by
Vanpelt Ryan L and Van Pelt Kristine P
Current Estimated Value
Home Financials for this Owner
Home Financials are based on the most recent Mortgage that was taken out on this home.
Original Mortgage
$167,000
Outstanding Balance
$105,727
Interest Rate
6.48%
Mortgage Type
Purchase Money Mortgage
Estimated Equity
$450,964
Purchase Details
Closed on
Jan 31, 1998
Sold by
U S Home Corp
Bought by
Mui Kwan Cheung and Ngai Hau Shim Mui
Home Financials for this Owner
Home Financials are based on the most recent Mortgage that was taken out on this home.
Original Mortgage
$124,550
Interest Rate
8.25%
Purchase Details
Closed on
Dec 1, 1994
Sold by
Richland Development Co Llc
Bought by
Gateway American Properties Llc
Purchase Details
Closed on
May 1, 1994
Sold by
Imago Enterprises Inc
Bought by
Richland Development Co Llc
Create a Home Valuation Report for This Property
The Home Valuation Report is an in-depth analysis detailing your home's value as well as a comparison with similar homes in the area
Purchase History
| Date | Buyer | Sale Price | Title Company |
|---|---|---|---|
| Vanpelt Ryan L | $224,000 | Guardian Title | |
| Mui Kwan Cheung | $178,636 | Stewart Title | |
| Gateway American Properties Llc | $448,300 | -- | |
| Richland Development Co Llc | $758,800 | -- |
Source: Public Records
Mortgage History
| Date | Status | Borrower | Loan Amount |
|---|---|---|---|
| Open | Vanpelt Ryan L | $167,000 | |
| Previous Owner | Mui Kwan Cheung | $124,550 |
Source: Public Records
Tax History
| Year | Tax Paid | Tax Assessment Tax Assessment Total Assessment is a certain percentage of the fair market value that is determined by local assessors to be the total taxable value of land and additions on the property. | Land | Improvement |
|---|---|---|---|---|
| 2025 | $3,315 | $33,151 | $2,813 | $30,338 |
| 2024 | $3,154 | $38,230 | $3,015 | $35,215 |
| 2022 | $2,661 | $28,176 | $3,128 | $25,048 |
| 2021 | $2,689 | $28,987 | $3,218 | $25,769 |
| 2020 | $2,963 | $31,668 | $3,218 | $28,450 |
| 2019 | $2,976 | $31,668 | $3,218 | $28,450 |
| 2018 | $2,241 | $24,588 | $3,240 | $21,348 |
| 2017 | $2,233 | $24,588 | $3,240 | $21,348 |
| 2016 | $2,063 | $22,598 | $3,582 | $19,016 |
| 2015 | $2,048 | $22,600 | $3,580 | $19,020 |
| 2014 | $1,773 | $19,440 | $3,580 | $15,860 |
Source: Public Records
Map
Nearby Homes
- 1819 Terrace Ct
- 1819 Antero Ct
- 2025 Amber Ct
- 1826 Thyme Ct
- 5225 White Willow Dr Unit B120
- 5225 White Willow Dr Unit Q220
- 5225 White Willow Dr Unit F200
- 5225 White Willow Dr Unit J210
- 4812 Mcmurry Ave
- 4913 Smallwood Ct
- 1501 Redberry Ct
- 1715 Globe Ct
- 2009 Timberline Ln
- 2215 Sweetwater Creek Dr
- 4751 Pleasant Oak Dr Unit C71
- 4751 Pleasant Oak Dr Unit C83
- 4751 Pleasant Oak Dr Unit B59
- 4751 Pleasant Oak Dr Unit C81
- 4751 Pleasant Oak Dr Unit C65
- 1808 Willow Springs Way
Your Personal Tour Guide
Ask me questions while you tour the home.