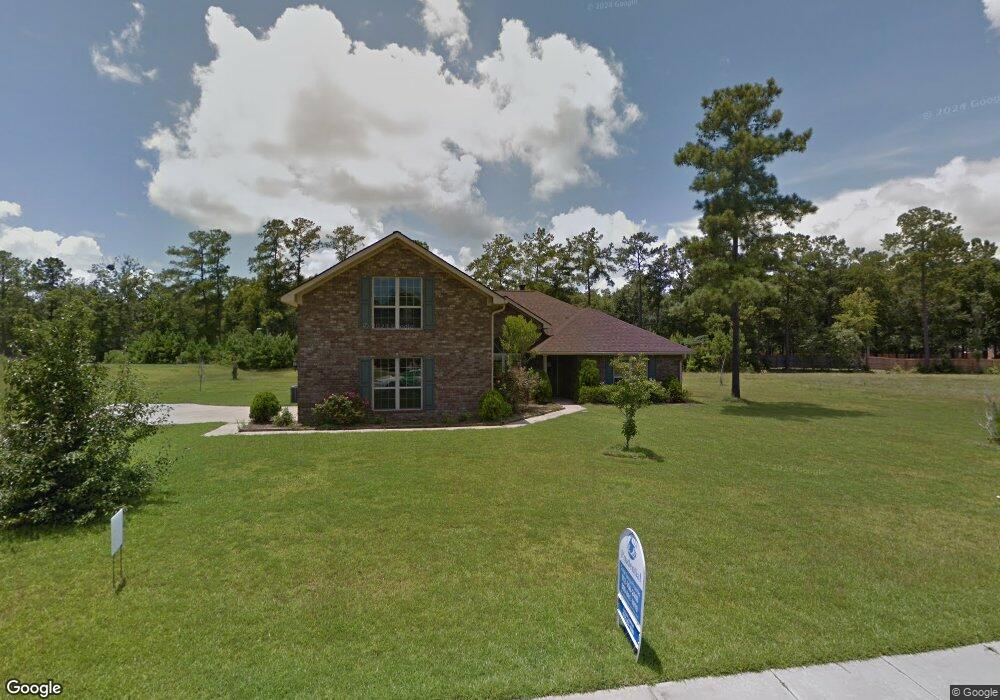
192 Prospect Loop Unit LOT 18 Midway, GA 31320
Estimated Value: $338,939 - $366,000
3
Beds
3
Baths
2,784
Sq Ft
$128/Sq Ft
Est. Value
About This Home
This home is located at 192 Prospect Loop Unit LOT 18, Midway, GA 31320 and is currently estimated at $356,485, approximately $128 per square foot. 192 Prospect Loop Unit LOT 18 is a home located in Liberty County with nearby schools including Liberty Elementary School, Midway Middle School, and Liberty County High School.
Ownership History
Date
Name
Owned For
Owner Type
Purchase Details
Closed on
Dec 4, 2014
Sold by
Pope Marvin L
Bought by
Frederick Roy A
Current Estimated Value
Home Financials for this Owner
Home Financials are based on the most recent Mortgage that was taken out on this home.
Original Mortgage
$175,500
Outstanding Balance
$135,270
Interest Rate
4.09%
Mortgage Type
New Conventional
Estimated Equity
$221,215
Purchase Details
Closed on
Jul 24, 2013
Sold by
Wells Fargo Bank
Bought by
Pope Marvin L
Purchase Details
Closed on
Nov 6, 2012
Sold by
Askew Dorothy
Bought by
Wells Fargo Bank Na Trustee
Purchase Details
Closed on
Sep 29, 2006
Sold by
Dryden Enterprises Inc
Bought by
Askew Robert L and Askew Dorothy
Home Financials for this Owner
Home Financials are based on the most recent Mortgage that was taken out on this home.
Original Mortgage
$186,232
Interest Rate
6.61%
Mortgage Type
New Conventional
Create a Home Valuation Report for This Property
The Home Valuation Report is an in-depth analysis detailing your home's value as well as a comparison with similar homes in the area
Home Values in the Area
Average Home Value in this Area
Purchase History
| Date | Buyer | Sale Price | Title Company |
|---|---|---|---|
| Frederick Roy A | $195,000 | -- | |
| Pope Marvin L | $130,200 | -- | |
| Wells Fargo Bank Na Trustee | $142,049 | -- | |
| Askew Robert L | $248,310 | -- |
Source: Public Records
Mortgage History
| Date | Status | Borrower | Loan Amount |
|---|---|---|---|
| Open | Frederick Roy A | $175,500 | |
| Previous Owner | Askew Robert L | $186,232 |
Source: Public Records
Tax History Compared to Growth
Tax History
| Year | Tax Paid | Tax Assessment Tax Assessment Total Assessment is a certain percentage of the fair market value that is determined by local assessors to be the total taxable value of land and additions on the property. | Land | Improvement |
|---|---|---|---|---|
| 2024 | $5,360 | $125,687 | $20,000 | $105,687 |
| 2023 | $5,360 | $104,558 | $16,000 | $88,558 |
| 2022 | $3,545 | $87,582 | $16,000 | $71,582 |
| 2021 | $3,245 | $80,090 | $16,000 | $64,090 |
| 2020 | $3,198 | $78,810 | $14,000 | $64,810 |
| 2019 | $3,146 | $79,530 | $14,000 | $65,530 |
| 2018 | $3,137 | $80,250 | $14,000 | $66,250 |
| 2017 | $2,666 | $80,970 | $14,000 | $66,970 |
| 2016 | $2,980 | $81,690 | $14,000 | $67,690 |
| 2015 | $1,978 | $81,690 | $14,000 | $67,690 |
| 2014 | $1,978 | $101,924 | $20,000 | $81,924 |
| 2013 | -- | $94,485 | $20,000 | $74,485 |
Source: Public Records
Map
Nearby Homes
- 46 Outpost Trail
- 70 1st St
- 221 Outpost Trail
- 99 Caraway Ct
- 24 Jerico Marsh Lot 24 Rd
- 41 Kinlock Ct
- 142 Oak Harvest Ridge
- 131 Haven Rd
- 169 Blue Jay Dr
- 42 Greenwood
- 63 Wye Rd
- 18 Wild Heron Dr
- 85 Wye Rd
- 87 Wye Rd
- 1613 Lake Dr
- 967 Lake Dr
- 4 2nd Ave
- 0 Oak Ct Unit SA331468
- 0 Oak Ct Unit 160688
- 1370 Lake Dr
- 192 Prospect Loop
- 162 Prospect Loop
- 222 Prospect Loop
- 193 Prospect Loop
- 181 Prospect Loop
- 244 Prospect Loop
- 219 Prospect Loop
- 1480 Limerick Rd
- 138 Prospect Loop
- 163 Prospect Loop
- 243 Prospect Loop
- 139 Prospect Loop
- 256 Prospect Loop
- 116 Prospect Loop
- 255 Prospect Loop
- 26 Outpost Trail
- 282 Prospect Loop
- 1404 Limerick Rd
- 117 Prospect Loop
- 279 Prospect Loop