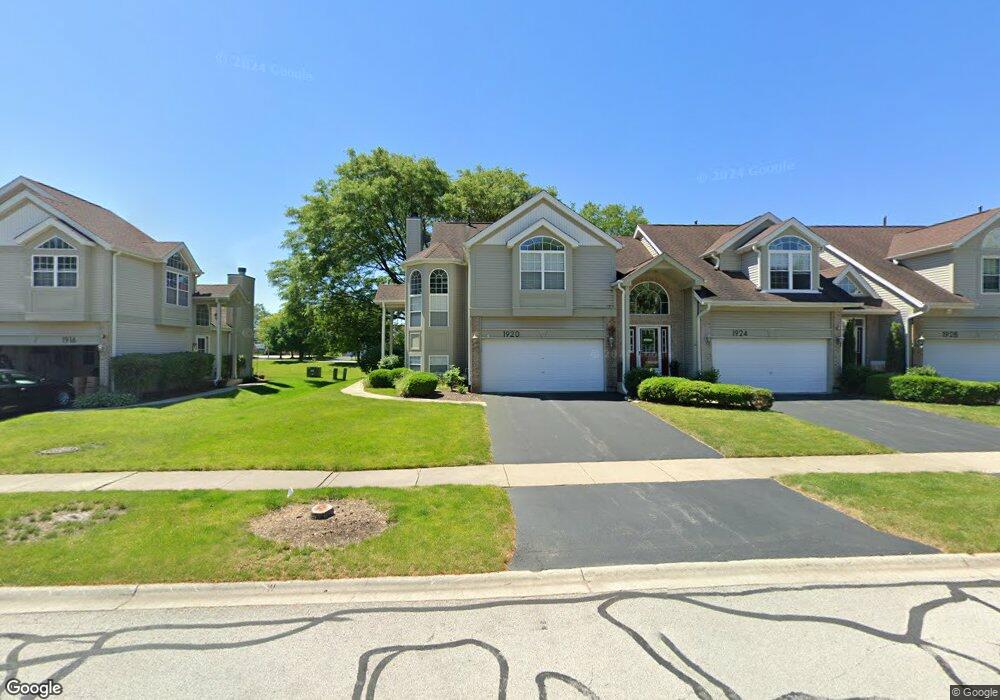
1920 Tamahawk Ln Unit 104 Naperville, IL 60564
Brook Crossing NeighborhoodEstimated Value: $353,857 - $389,000
--
Bed
2
Baths
1,656
Sq Ft
$220/Sq Ft
Est. Value
About This Home
This home is located at 1920 Tamahawk Ln Unit 104, Naperville, IL 60564 and is currently estimated at $364,714, approximately $220 per square foot. 1920 Tamahawk Ln Unit 104 is a home located in Will County with nearby schools including Robert Clow Elementary School, Ellsworth Elementary School, and Gordon Gregory Middle School.
Ownership History
Date
Name
Owned For
Owner Type
Purchase Details
Closed on
Jan 20, 2006
Sold by
Cannon Ellen and Riggs Paula S
Bought by
Wasey Syed A and Warcaba Amy B
Current Estimated Value
Home Financials for this Owner
Home Financials are based on the most recent Mortgage that was taken out on this home.
Original Mortgage
$245,000
Outstanding Balance
$137,953
Interest Rate
6.3%
Mortgage Type
Fannie Mae Freddie Mac
Estimated Equity
$226,761
Purchase Details
Closed on
Jan 25, 2002
Sold by
Seel Mary P and Mary P Seel Revocable Trust
Bought by
Cannon Ellen and Riggs Paula S
Purchase Details
Closed on
Dec 30, 1996
Sold by
Kovarik Michael R and Kovarik Amy E
Bought by
Seei Mary P and The Mary P Seei Revocable Trus
Home Financials for this Owner
Home Financials are based on the most recent Mortgage that was taken out on this home.
Original Mortgage
$121,000
Interest Rate
7.58%
Create a Home Valuation Report for This Property
The Home Valuation Report is an in-depth analysis detailing your home's value as well as a comparison with similar homes in the area
Home Values in the Area
Average Home Value in this Area
Purchase History
| Date | Buyer | Sale Price | Title Company |
|---|---|---|---|
| Wasey Syed A | $245,000 | None Available | |
| Cannon Ellen | -- | -- | |
| Seei Mary P | $150,000 | Chicago Title Insurance Co |
Source: Public Records
Mortgage History
| Date | Status | Borrower | Loan Amount |
|---|---|---|---|
| Open | Wasey Syed A | $245,000 | |
| Previous Owner | Seei Mary P | $121,000 |
Source: Public Records
Tax History Compared to Growth
Tax History
| Year | Tax Paid | Tax Assessment Tax Assessment Total Assessment is a certain percentage of the fair market value that is determined by local assessors to be the total taxable value of land and additions on the property. | Land | Improvement |
|---|---|---|---|---|
| 2024 | $7,409 | $113,111 | $24,607 | $88,504 |
| 2023 | $7,409 | $99,922 | $21,738 | $78,184 |
| 2022 | $6,501 | $89,731 | $20,563 | $69,168 |
| 2021 | $6,225 | $85,458 | $19,584 | $65,874 |
| 2020 | $6,110 | $84,104 | $19,274 | $64,830 |
| 2019 | $6,012 | $81,734 | $18,731 | $63,003 |
| 2018 | $6,079 | $81,154 | $18,319 | $62,835 |
| 2017 | $5,993 | $79,059 | $17,846 | $61,213 |
| 2016 | $5,987 | $77,357 | $17,462 | $59,895 |
| 2015 | $6,619 | $74,381 | $16,790 | $57,591 |
| 2014 | $6,619 | $80,470 | $16,790 | $63,680 |
| 2013 | $6,619 | $80,470 | $16,790 | $63,680 |
Source: Public Records
Map
Nearby Homes
- 2949 Brossman St
- 2207 Sisters Ave
- 2636 Salix Cir
- 3004 Bennett Dr
- 28W555 Leverenz Rd
- 2736 Bluewater Cir
- 1305 Morningstar Ct Unit 1A
- 3212 Austin Ct
- 2543 Dewes Ln
- 2741 Gateshead Dr
- 2866 Stonewater Dr Unit 102
- 3432 Caine Dr
- 1123 Thackery Ln
- 1329 Neskola Ct
- 3616 Eliot Ln
- 2301 Mecan Dr
- 1321 Galena Ct
- 1134 Gateshead Dr
- 1116 Hollingswood Ave
- 2611 Cedar Glade Dr Unit 204
- 1928 Tamahawk Ln Unit 112
- 1932 Tamahawk Ln Unit 116
- 1924 Tamahawk Ln Unit 108
- 2848 Alandale Cir Unit 2848
- 2852 Alandale Cir Unit 2852
- 2844 Alandale Cir Unit 2844
- 2856 Alandale Cir Unit 2856
- 1904 Tamahawk Ln Unit 1904
- 1912 Tamahawk Ln Unit 1912
- 1916 Tamahawk Ln Unit 1916
- 1908 Tamahawk Ln
- 1940 Tamahawk Ln Unit 108
- 1944 Tamahawk Ln Unit 112
- 1948 Tamahawk Ln
- 1936 Tamahawk Ln
- 1931 Tamahawk Ln Unit 115
- 1919 Tamahawk Ln Unit 103
- 1927 Tamahawk Ln Unit 111
- 1931 Tamahawk Ln
- 2836 Alandale Cir Unit 2836