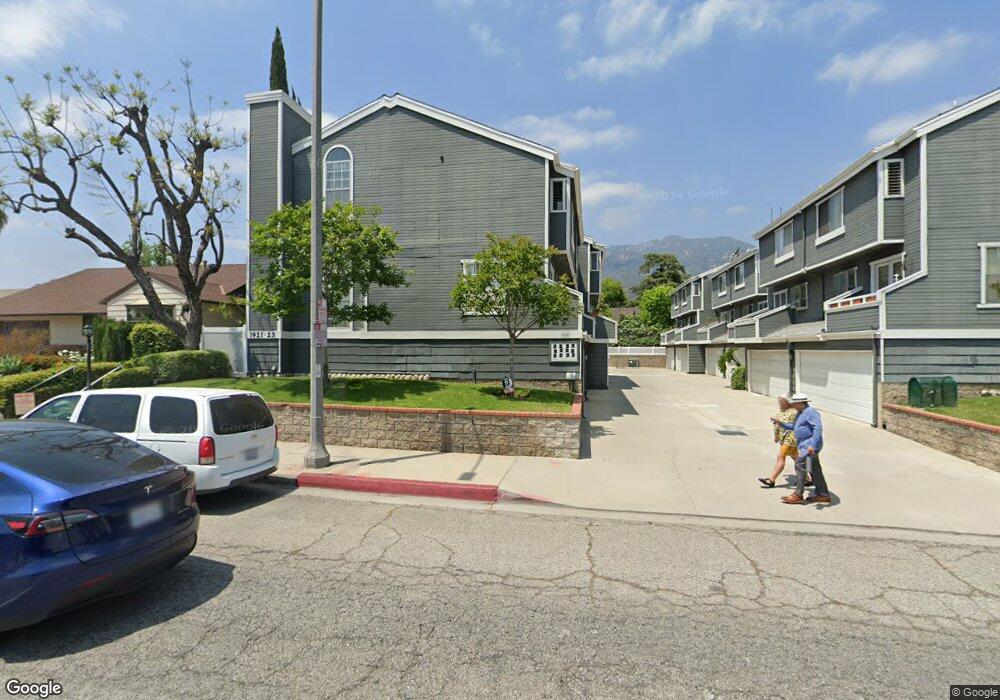
1921 E Washington Blvd Unit 1 Pasadena, CA 91104
East Washington Village NeighborhoodEstimated Value: $651,107 - $706,000
2
Beds
3
Baths
1,102
Sq Ft
$619/Sq Ft
Est. Value
About This Home
This home is located at 1921 E Washington Blvd Unit 1, Pasadena, CA 91104 and is currently estimated at $682,277, approximately $619 per square foot. 1921 E Washington Blvd Unit 1 is a home located in Los Angeles County with nearby schools including Webster Elementary School, Charles W. Eliot Arts Magnet Academy, and Pasadena High School.
Ownership History
Date
Name
Owned For
Owner Type
Purchase Details
Closed on
Jul 30, 2025
Sold by
Slead Joann K
Bought by
Jk Slead Trust and Slead
Current Estimated Value
Purchase Details
Closed on
Nov 14, 2001
Sold by
Slead Joann
Bought by
Slead Joann K
Home Financials for this Owner
Home Financials are based on the most recent Mortgage that was taken out on this home.
Original Mortgage
$141,000
Interest Rate
6.57%
Purchase Details
Closed on
Mar 28, 2000
Sold by
Christiansen Robert G
Bought by
Christiansen Yolanda M
Home Financials for this Owner
Home Financials are based on the most recent Mortgage that was taken out on this home.
Original Mortgage
$140,250
Interest Rate
8.3%
Purchase Details
Closed on
Feb 23, 2000
Sold by
Moran Yolanda
Bought by
Slead Joann
Home Financials for this Owner
Home Financials are based on the most recent Mortgage that was taken out on this home.
Original Mortgage
$140,250
Interest Rate
8.3%
Create a Home Valuation Report for This Property
The Home Valuation Report is an in-depth analysis detailing your home's value as well as a comparison with similar homes in the area
Home Values in the Area
Average Home Value in this Area
Purchase History
| Date | Buyer | Sale Price | Title Company |
|---|---|---|---|
| Jk Slead Trust | -- | None Listed On Document | |
| Slead Joann K | -- | Gateway Title Company | |
| Christiansen Yolanda M | -- | Chicago Title | |
| Slead Joann | $165,000 | Chicago Title |
Source: Public Records
Mortgage History
| Date | Status | Borrower | Loan Amount |
|---|---|---|---|
| Previous Owner | Slead Joann K | $141,000 | |
| Previous Owner | Slead Joann | $140,250 |
Source: Public Records
Tax History
| Year | Tax Paid | Tax Assessment Tax Assessment Total Assessment is a certain percentage of the fair market value that is determined by local assessors to be the total taxable value of land and additions on the property. | Land | Improvement |
|---|---|---|---|---|
| 2025 | $3,179 | $253,571 | $131,552 | $122,019 |
| 2024 | $3,179 | $248,600 | $128,973 | $119,627 |
| 2023 | $3,147 | $243,727 | $126,445 | $117,282 |
| 2022 | $3,040 | $238,949 | $123,966 | $114,983 |
| 2021 | $2,863 | $234,265 | $121,536 | $112,729 |
| 2019 | $2,758 | $227,319 | $117,932 | $109,387 |
| 2018 | $2,791 | $222,863 | $115,620 | $107,243 |
| 2016 | $2,694 | $214,211 | $111,131 | $103,080 |
| 2015 | $2,664 | $210,994 | $109,462 | $101,532 |
| 2014 | $2,617 | $206,862 | $107,318 | $99,544 |
Source: Public Records
Map
Nearby Homes
- 1932 E Washington Blvd
- 1430 N Dominion Ave
- 1667 N Allen Ave
- 1786 Asbury Dr
- 2235 Garfias Dr
- 1274 N Sierra Bonita Ave
- 1670 Asbury Dr
- 1670 N Oxford Ave
- 2209 Queensberry Rd
- 1453 Bresee Ave
- 1685 Roosevelt Ave
- 1364 N Harding Ave
- 1155 N Sierra Bonita Ave
- 1768 Casa Grande St
- 1818 New York Dr
- 951 N Allen Ave
- 1511 Coolidge Ave
- 1716 N Roosevelt Ave
- 1221 Wesley Ave
- 1130 Wesley Ave
- 1933 E Washington Blvd
- 1921 E Washington Blvd Unit 2
- 1927 E Washington Blvd Unit 4
- 1933 E Washington Blvd Unit 1
- 1927 E Washington Blvd Unit 3
- 1927 E Washington Blvd Unit 2
- 1927 E Washington Blvd Unit 1
- 1931 E Washington Blvd Unit 1
- 1931 E Washington Blvd Unit 2
- 1933 E Washington Blvd Unit 4
- 1933 E Washington Blvd Unit 3
- 1933 E Washington Blvd Unit 2
- 1929 E Washington Blvd
- 1923 E Washington Blvd Unit 1
- 1923 E Washington Blvd Unit 2
- 1923 E Washington Blvd Unit 3
- 1923 E Washington Blvd Unit 4
- 1925 E Washington Blvd Unit 2
- 1925 E Washington Blvd Unit 1
- 1929 E Washington Blvd Unit 1
Your Personal Tour Guide
Ask me questions while you tour the home.