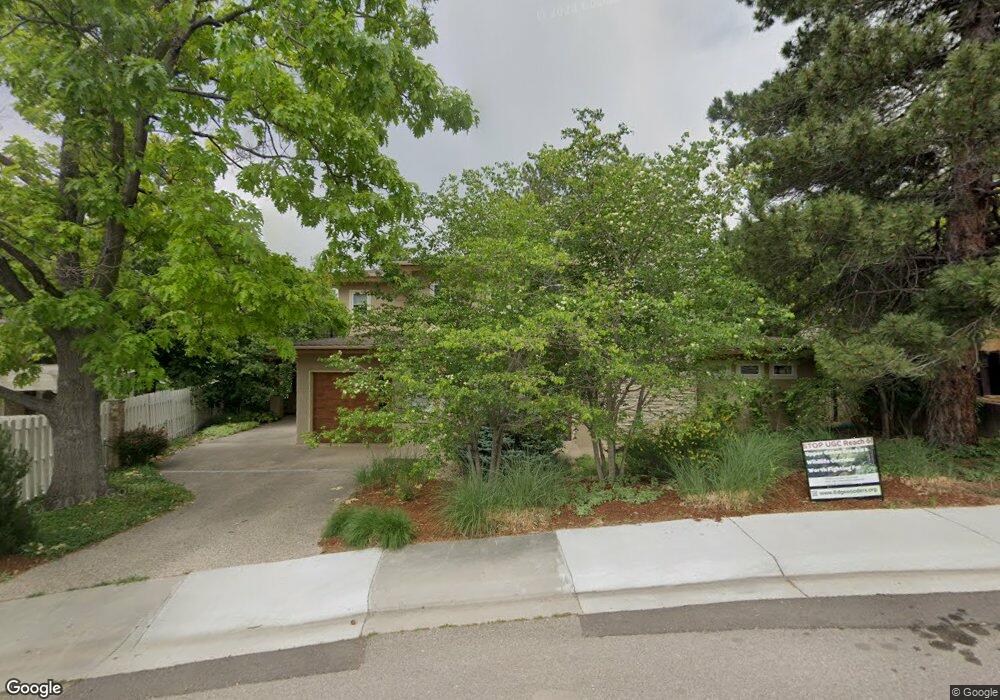
1921 Tyler Rd Boulder, CO 80304
Central Boulder NeighborhoodEstimated Value: $2,393,000 - $3,521,000
4
Beds
4
Baths
3,467
Sq Ft
$881/Sq Ft
Est. Value
About This Home
This home is located at 1921 Tyler Rd, Boulder, CO 80304 and is currently estimated at $3,055,639, approximately $881 per square foot. 1921 Tyler Rd is a home located in Boulder County with nearby schools including Whittier Elementary School, Casey Middle School, and Boulder High School.
Ownership History
Date
Name
Owned For
Owner Type
Purchase Details
Closed on
Mar 6, 2008
Sold by
Blumenhein Abby L and Jacobs Christopher C
Bought by
Bennett Brian
Current Estimated Value
Home Financials for this Owner
Home Financials are based on the most recent Mortgage that was taken out on this home.
Original Mortgage
$1,000,000
Outstanding Balance
$613,905
Interest Rate
5.47%
Mortgage Type
Purchase Money Mortgage
Estimated Equity
$2,441,734
Purchase Details
Closed on
Jan 20, 2005
Sold by
Mcintyre Barbara
Bought by
Jacobs Christopher C and Blumenhein Abby L
Home Financials for this Owner
Home Financials are based on the most recent Mortgage that was taken out on this home.
Original Mortgage
$900,000
Interest Rate
5.68%
Mortgage Type
Purchase Money Mortgage
Purchase Details
Closed on
Jan 13, 2000
Sold by
Harris Kathryn L
Bought by
Werner Traci D
Create a Home Valuation Report for This Property
The Home Valuation Report is an in-depth analysis detailing your home's value as well as a comparison with similar homes in the area
Home Values in the Area
Average Home Value in this Area
Purchase History
| Date | Buyer | Sale Price | Title Company |
|---|---|---|---|
| Bennett Brian | $1,275,000 | Land Title Guarantee Company | |
| Jacobs Christopher C | $1,200,000 | Land Title Guarantee Company | |
| Werner Traci D | $260,000 | -- |
Source: Public Records
Mortgage History
| Date | Status | Borrower | Loan Amount |
|---|---|---|---|
| Open | Bennett Brian | $1,000,000 | |
| Previous Owner | Jacobs Christopher C | $900,000 |
Source: Public Records
Tax History Compared to Growth
Tax History
| Year | Tax Paid | Tax Assessment Tax Assessment Total Assessment is a certain percentage of the fair market value that is determined by local assessors to be the total taxable value of land and additions on the property. | Land | Improvement |
|---|---|---|---|---|
| 2025 | $21,108 | $222,363 | $100,163 | $122,200 |
| 2024 | $21,108 | $222,363 | $100,163 | $122,200 |
| 2023 | $20,741 | $240,175 | $104,822 | $139,038 |
| 2022 | $19,069 | $205,345 | $81,788 | $123,557 |
| 2021 | $18,184 | $211,254 | $84,141 | $127,113 |
| 2020 | $14,204 | $163,178 | $77,864 | $85,314 |
| 2019 | $13,986 | $163,178 | $77,864 | $85,314 |
| 2018 | $14,077 | $162,367 | $64,944 | $97,423 |
| 2017 | $13,637 | $179,506 | $71,799 | $107,707 |
| 2016 | $13,200 | $152,490 | $60,974 | $91,516 |
| 2015 | $12,500 | $113,032 | $51,422 | $61,610 |
| 2014 | $9,504 | $113,032 | $51,422 | $61,610 |
Source: Public Records
Map
Nearby Homes
- 1895 Alpine Ave Unit G21
- 1895 Alpine Ave Unit E18
- 2870 18th St
- 2935 19th St
- 2206 Alpine Dr
- 2941 21st St
- 1557 North St
- 2240 Bluff St
- 2225 Pine St
- 1526 Sunset Blvd
- 1709 Pine St Unit 3
- 3055 23rd St
- 3010 14th St
- 1450 High St
- 1303 Alpine Ave Unit 24A
- 2991 25th St
- 2201 Pearl St Unit 224
- 1267 Balsam Ave
- 1265 Balsam Ave
- 1241 Balsam Ave
- 1931 Tyler Rd
- 1911 Tyler Rd
- 1940 Edgewood Dr
- 1920 Edgewood Dr
- 1950 Edgewood Dr
- 1975 Balsam Dr
- 1941 Tyler Rd
- 1922 Tyler Rd
- 1900 Edgewood Dr
- 1985 Balsam Dr
- 1960 Edgewood Dr
- 1921 Alpine Ave
- 1912 Tyler Rd
- 1951 Alpine Ave
- 1965 Alpine Ave
- 2003 Balsam Dr
- 1980 Edgewood Dr
- 1911 Alpine Ave
- 2800 19th St
- 1890 Balsam Ave