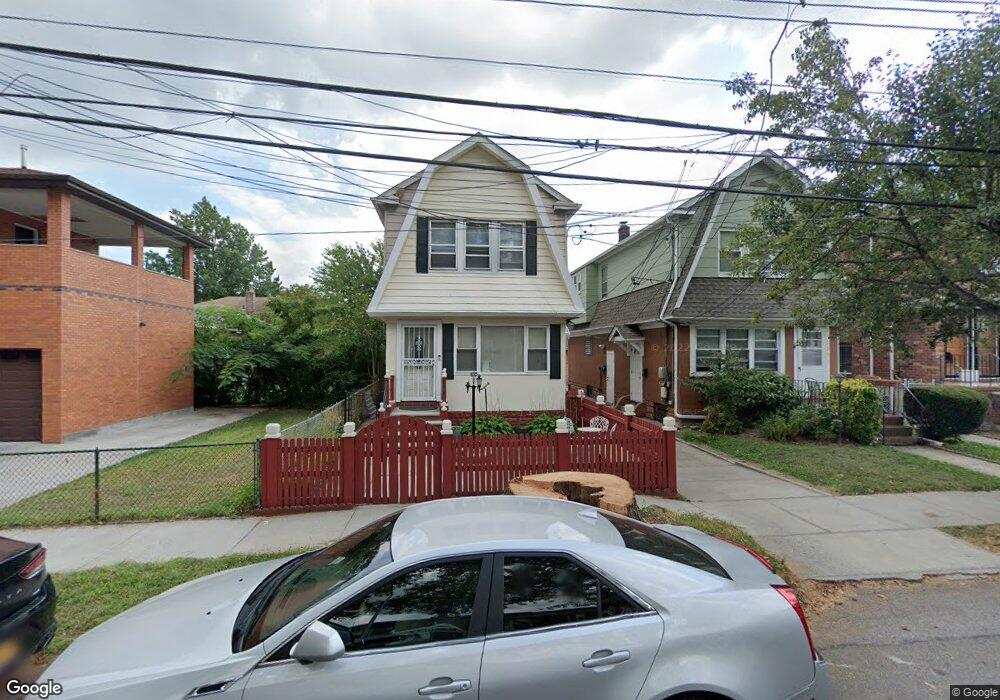
19210 42nd Ave Unit 1 Flushing, NY 11358
Auburndale NeighborhoodEstimated Value: $1,154,309 - $1,326,000
1
Bed
1
Bath
1,584
Sq Ft
$785/Sq Ft
Est. Value
About This Home
This home is located at 19210 42nd Ave Unit 1, Flushing, NY 11358 and is currently estimated at $1,243,577, approximately $785 per square foot. 19210 42nd Ave Unit 1 is a home located in Queens County with nearby schools including P.S. 31 - Bayside, I.S. 25 Adrien Block, and Francis Lewis High School.
Ownership History
Date
Name
Owned For
Owner Type
Purchase Details
Closed on
Nov 3, 2023
Sold by
Sim Jong Won and Sim Kyong Nan
Bought by
Chen Bin
Current Estimated Value
Home Financials for this Owner
Home Financials are based on the most recent Mortgage that was taken out on this home.
Original Mortgage
$754,000
Outstanding Balance
$740,361
Interest Rate
7.31%
Mortgage Type
Purchase Money Mortgage
Estimated Equity
$503,216
Purchase Details
Closed on
Jun 7, 2006
Sold by
Dung Fow Yee As Trustee and So Yee As Trustee
Bought by
Sim Jong Won and Sim Kyong Nan
Home Financials for this Owner
Home Financials are based on the most recent Mortgage that was taken out on this home.
Original Mortgage
$476,000
Interest Rate
6.6%
Mortgage Type
Purchase Money Mortgage
Purchase Details
Closed on
Dec 8, 2005
Sold by
Yee Dung Fow and Yee So
Bought by
Yee So
Create a Home Valuation Report for This Property
The Home Valuation Report is an in-depth analysis detailing your home's value as well as a comparison with similar homes in the area
Home Values in the Area
Average Home Value in this Area
Purchase History
| Date | Buyer | Sale Price | Title Company |
|---|---|---|---|
| Chen Bin | $1,160,000 | -- | |
| Sim Jong Won | $595,000 | -- | |
| Yee So | -- | -- |
Source: Public Records
Mortgage History
| Date | Status | Borrower | Loan Amount |
|---|---|---|---|
| Open | Chen Bin | $754,000 | |
| Previous Owner | Sim Jong Won | $476,000 |
Source: Public Records
Tax History
| Year | Tax Paid | Tax Assessment Tax Assessment Total Assessment is a certain percentage of the fair market value that is determined by local assessors to be the total taxable value of land and additions on the property. | Land | Improvement |
|---|---|---|---|---|
| 2025 | $7,861 | $40,128 | $9,105 | $31,023 |
| 2024 | $7,861 | $39,139 | $10,642 | $28,497 |
| 2023 | $7,135 | $36,924 | $9,940 | $26,984 |
| 2022 | $6,667 | $53,160 | $16,200 | $36,960 |
| 2021 | $7,014 | $55,080 | $16,200 | $38,880 |
| 2020 | $6,782 | $56,040 | $16,200 | $39,840 |
| 2019 | $6,530 | $60,060 | $16,200 | $43,860 |
| 2018 | $5,975 | $30,770 | $9,604 | $21,166 |
| 2017 | $5,618 | $29,030 | $10,179 | $18,851 |
| 2016 | $5,477 | $29,030 | $10,179 | $18,851 |
| 2015 | $3,083 | $27,867 | $12,553 | $15,314 |
| 2014 | $3,083 | $27,180 | $14,692 | $12,488 |
Source: Public Records
Map
Nearby Homes
- 4048 194th St Unit A3
- 40-38 194th St Unit 1A
- 4038 194th St Unit 3B
- 190-17 42nd Ave
- 4032 195th St
- 42-25 189th St
- 19112 Station Rd
- 43-44 195th St
- 42-28 189th St
- 194-23 Station Rd
- 188-02 Northern Blvd
- 193-02 39th Ave Unit 1
- 191-02 39th Ave
- 191-9 39th Ave Unit 164
- 190-05 39th Ave Unit 142
- 195-33 39th Ave
- 4539 192nd St
- 189-23 39th Ave Unit 122
- 45-31 195th St
- 45-47 193rd St
- 192-10 42nd Ave Unit 1FL
- 192-10 42nd Ave
- 19210 42nd Ave
- 19210 42nd Ave
- 19208 42nd Ave
- 192-04 42nd Ave Unit 2F
- 192-04 42nd Ave Unit 1
- 19204 42nd Ave Unit 2F
- 19204 42nd Ave
- 4204 193rd St
- 4208 193rd St
- 42-11 192nd St Unit Front
- 42-11 192nd St Unit Back
- 4211 192nd St
- 4212 193rd St
- 42-04 193rd St
- 42-27 192nd St Unit 2 Fl
- 19211 42nd Ave
- 19211 42nd Ave Unit 3
- 19211 42nd Ave Unit 3
Your Personal Tour Guide
Ask me questions while you tour the home.