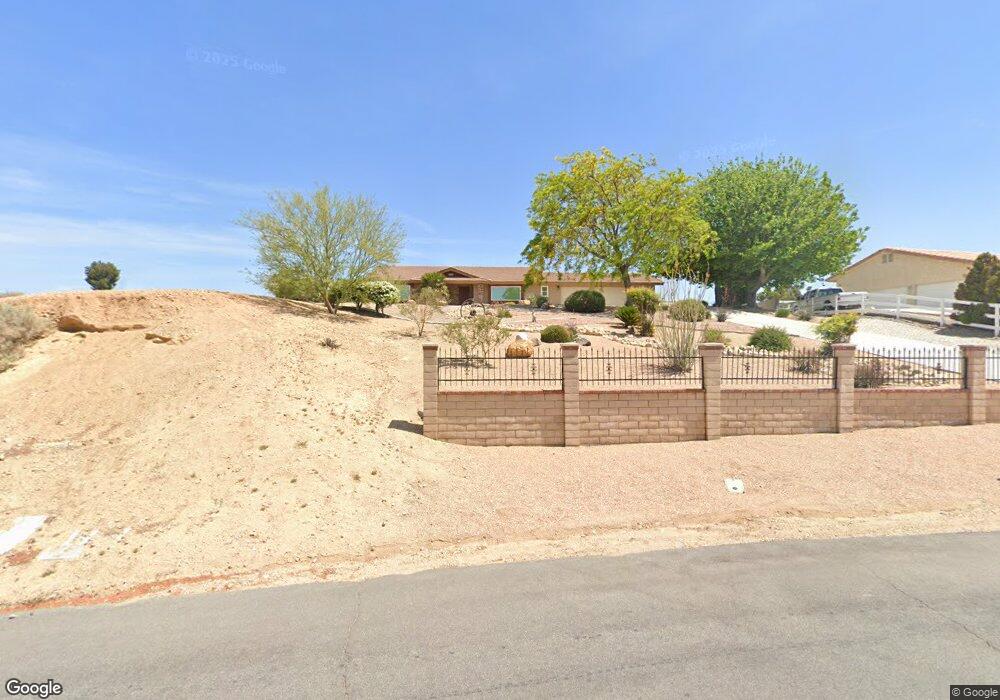
19210 Saddle Ln Apple Valley, CA 92308
High Desert NeighborhoodEstimated Value: $465,073 - $597,000
3
Beds
3
Baths
1,840
Sq Ft
$281/Sq Ft
Est. Value
About This Home
This home is located at 19210 Saddle Ln, Apple Valley, CA 92308 and is currently estimated at $517,768, approximately $281 per square foot. 19210 Saddle Ln is a home located in San Bernardino County with nearby schools including Rio Vista School of Applied Learning, Apple Valley High School, and Excelsior Charter School.
Ownership History
Date
Name
Owned For
Owner Type
Purchase Details
Closed on
Aug 13, 2003
Sold by
Coyer Michael Terry
Bought by
Dicus David and Dicus Teresa
Current Estimated Value
Home Financials for this Owner
Home Financials are based on the most recent Mortgage that was taken out on this home.
Original Mortgage
$180,000
Interest Rate
6.27%
Mortgage Type
Purchase Money Mortgage
Purchase Details
Closed on
Dec 2, 2002
Sold by
Peticolas Michael W and Peticolas Alaura C
Bought by
Coyer Michael Terry
Home Financials for this Owner
Home Financials are based on the most recent Mortgage that was taken out on this home.
Original Mortgage
$179,550
Interest Rate
5.86%
Purchase Details
Closed on
Jul 29, 1999
Sold by
Stabile Lori and Schrader Lori
Bought by
Peticolas Michael W and Peticolas Alaura C
Home Financials for this Owner
Home Financials are based on the most recent Mortgage that was taken out on this home.
Original Mortgage
$120,000
Interest Rate
7.64%
Create a Home Valuation Report for This Property
The Home Valuation Report is an in-depth analysis detailing your home's value as well as a comparison with similar homes in the area
Home Values in the Area
Average Home Value in this Area
Purchase History
| Date | Buyer | Sale Price | Title Company |
|---|---|---|---|
| Dicus David | $225,000 | First American | |
| Coyer Michael Terry | $189,000 | Chicago Title Co | |
| Peticolas Michael W | $132,000 | First American Title Ins Co | |
| Schrader Lori | -- | First American Title |
Source: Public Records
Mortgage History
| Date | Status | Borrower | Loan Amount |
|---|---|---|---|
| Previous Owner | Dicus David | $180,000 | |
| Previous Owner | Coyer Michael Terry | $179,550 | |
| Previous Owner | Peticolas Michael W | $120,000 |
Source: Public Records
Tax History Compared to Growth
Tax History
| Year | Tax Paid | Tax Assessment Tax Assessment Total Assessment is a certain percentage of the fair market value that is determined by local assessors to be the total taxable value of land and additions on the property. | Land | Improvement |
|---|---|---|---|---|
| 2025 | $2,548 | $227,318 | $39,191 | $188,127 |
| 2024 | $2,548 | $222,861 | $38,423 | $184,438 |
| 2023 | $2,523 | $218,492 | $37,670 | $180,822 |
| 2022 | $2,484 | $214,207 | $36,931 | $177,276 |
| 2021 | $2,425 | $210,007 | $36,207 | $173,800 |
| 2020 | $2,395 | $207,854 | $35,836 | $172,018 |
| 2019 | $2,350 | $203,778 | $35,133 | $168,645 |
| 2018 | $2,291 | $199,782 | $34,444 | $165,338 |
| 2017 | $2,258 | $195,865 | $33,769 | $162,096 |
| 2016 | $2,160 | $192,025 | $33,107 | $158,918 |
| 2015 | $2,127 | $189,141 | $32,610 | $156,531 |
| 2014 | $2,097 | $185,436 | $31,971 | $153,465 |
Source: Public Records
Map
Nearby Homes
- 0 Bay Meadows Dr
- 12682 Mar Vista Dr
- 19149 Catalina Rd
- 12720 Yorkshire Dr
- 0 Westmont Dr
- 1 Apple Valley Rd
- 19333 Town Center
- 19575 Bear Valley Rd
- 0 Town Center Dr
- 19218 Elm Dr
- 0 Juniper Dr Unit CV25238237
- 19183 Elm Dr
- 19773 Bear Valley Rd
- 11670 Wedgewood Dr
- 18935 Lariat St
- 18929 Lariat St
- 12971 Lompoc Rd
- 19348 Birdie Way
- 18920 Lasso St
- 12982 Topsham Bay
- 19230 Saddle Ln
- 19190 Saddle Ln
- 19195 Saddle Ln
- 19245 Pinto Way
- 19215 Saddle Ln
- 19225 Pinto Way
- 12365 Yorkshire Dr
- 12485 Palomino Ln
- 12375 Yorkshire Dr
- 13275 Yorkshire Dr
- 12345 Yorkshire Dr
- 19175 Saddle Ln
- 12335 Yorkshire Dr
- 0 #142 Lot Pinto Way Unit IV16196044
- 12415 Palomino Ln
- 19155 Saddle Ln
- 12415 Yorkshire Dr
- 19220 Pinto Way
- 0 Pinto Way
- 12315 Yorkshire Dr