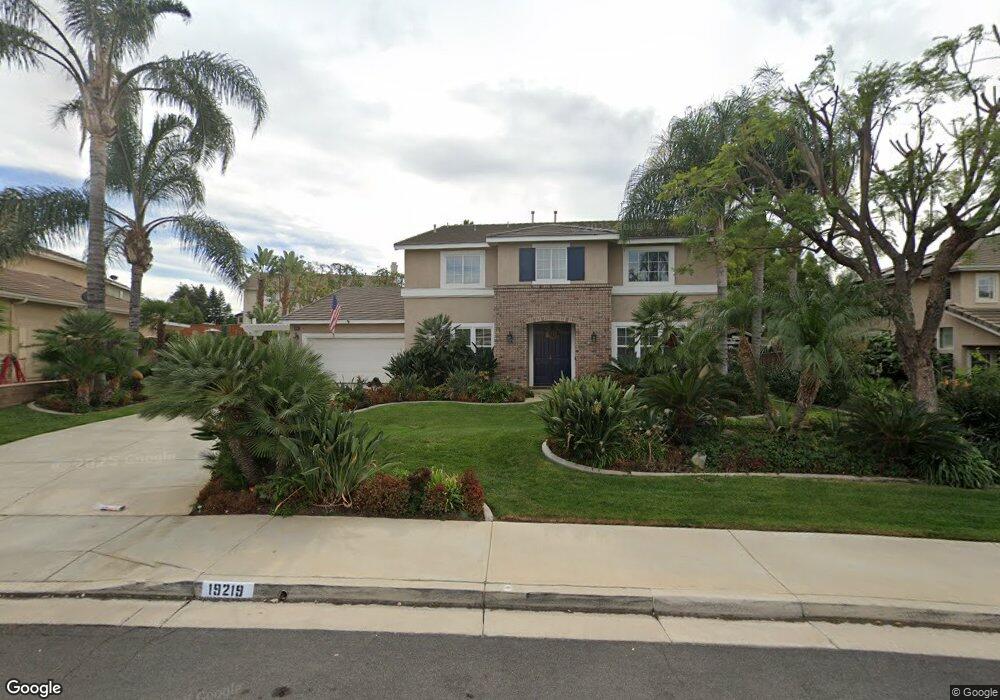
19219 Hitching Post Place Riverside, CA 92508
Orangecrest NeighborhoodEstimated Value: $875,331 - $946,000
6
Beds
4
Baths
3,521
Sq Ft
$256/Sq Ft
Est. Value
About This Home
This home is located at 19219 Hitching Post Place, Riverside, CA 92508 and is currently estimated at $900,833, approximately $255 per square foot. 19219 Hitching Post Place is a home located in Riverside County with nearby schools including John F. Kennedy Elementary School, Amelia Earhart Middle School, and Martin Luther King Junior High School.
Ownership History
Date
Name
Owned For
Owner Type
Purchase Details
Closed on
Oct 22, 2021
Sold by
Alfaro Rosenberg and Rodriguez Martha
Bought by
Alfaro Rosenberg and Rodriguez Martha
Current Estimated Value
Home Financials for this Owner
Home Financials are based on the most recent Mortgage that was taken out on this home.
Original Mortgage
$298,650
Outstanding Balance
$230,430
Interest Rate
2.33%
Mortgage Type
New Conventional
Estimated Equity
$670,403
Purchase Details
Closed on
Nov 13, 2015
Sold by
Orangecrest Country Community Associatio
Bought by
Alfaro Rosenberg and Rodriguez Martha
Purchase Details
Closed on
Oct 30, 2001
Sold by
Standard Pacific Corp
Bought by
Alfaro Rosenberg and Rodriguez Martha
Home Financials for this Owner
Home Financials are based on the most recent Mortgage that was taken out on this home.
Original Mortgage
$265,950
Interest Rate
6.67%
Create a Home Valuation Report for This Property
The Home Valuation Report is an in-depth analysis detailing your home's value as well as a comparison with similar homes in the area
Home Values in the Area
Average Home Value in this Area
Purchase History
| Date | Buyer | Sale Price | Title Company |
|---|---|---|---|
| Alfaro Rosenberg | -- | First American Title Ins Co | |
| Alfaro Rosenberg | -- | None Available | |
| Alfaro Rosenberg | $296,000 | First American Title Co |
Source: Public Records
Mortgage History
| Date | Status | Borrower | Loan Amount |
|---|---|---|---|
| Open | Alfaro Rosenberg | $298,650 | |
| Previous Owner | Alfaro Rosenberg | $265,950 |
Source: Public Records
Tax History
| Year | Tax Paid | Tax Assessment Tax Assessment Total Assessment is a certain percentage of the fair market value that is determined by local assessors to be the total taxable value of land and additions on the property. | Land | Improvement |
|---|---|---|---|---|
| 2025 | $6,871 | $634,261 | $86,204 | $548,057 |
| 2023 | $6,871 | $609,633 | $82,857 | $526,776 |
| 2022 | $6,715 | $597,681 | $81,233 | $516,448 |
| 2021 | $6,620 | $585,963 | $79,641 | $506,322 |
| 2020 | $6,570 | $579,956 | $78,825 | $501,131 |
| 2019 | $6,446 | $568,585 | $77,280 | $491,305 |
| 2018 | $6,320 | $557,437 | $75,766 | $481,671 |
| 2017 | $6,430 | $546,508 | $74,281 | $472,227 |
| 2016 | $6,126 | $535,793 | $72,825 | $462,968 |
| 2015 | $6,035 | $525,289 | $71,398 | $453,891 |
| 2014 | $4,403 | $358,993 | $72,300 | $286,693 |
Source: Public Records
Map
Nearby Homes
- 8345 Carriage Ct
- 19435 Fortunello Ave
- 8072 Branding Iron Ln
- 8564 Mill Pond Place
- 8034 Palm View Ln
- 14787 Wood Rd
- 8054 Armagosa Dr
- 14779 Wood Rd
- 1125 Pamplona Dr
- 8634 Cabin Place
- 19377 Mt Wasatch Dr
- 19689 Allenhurst St
- 8470 Lindenhurst St
- 8402 Lindenhurst St
- 18590 Roberts Rd
- 1195 Pamplona Dr
- 8052 Citricado Ln
- 14435 Wood Rd
- 0 Old Frontage Rd Unit OC25137111
- 7235 Ayers Rock Rd
- 19205 Hitching Post Place
- 19227 Hitching Post Place
- 19204 Buckboard Ln
- 19220 Buckboard Ln
- 19198 Buckboard Ln
- 19197 Hitching Post Place
- 19228 Buckboard Ln
- 19237 Hitching Post Place
- 19228 Hitching Post Place
- 19204 Hitching Post Place
- 19190 Buckboard Ln
- 19238 Buckboard Ln
- 19189 Hitching Post Place
- 19238 Hitching Post Place
- 19247 Hitching Post Place
- 19205 Buckboard Ln
- 19197 Buckboard Ln
- 19225 Buckboard Ln
- 19219 Buckboard Ln
- 19248 Buckboard Ln
Your Personal Tour Guide
Ask me questions while you tour the home.