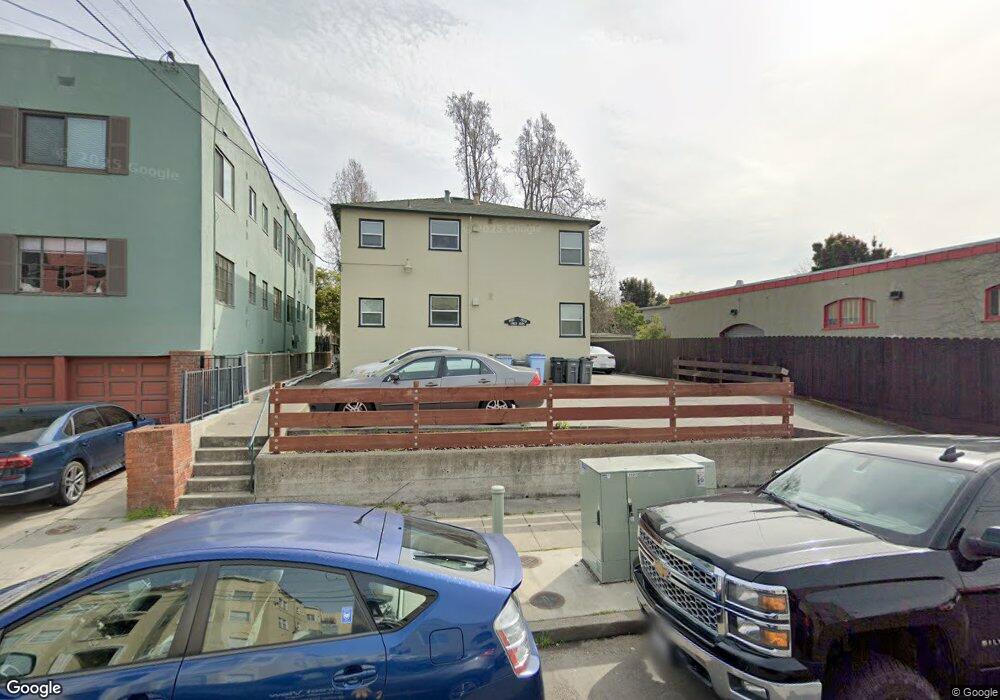
1923 Curtis St Berkeley, CA 94702
West Berkeley NeighborhoodEstimated Value: $947,000 - $1,275,000
Studio
--
Bath
1,816
Sq Ft
$637/Sq Ft
Est. Value
About This Home
This home is located at 1923 Curtis St, Berkeley, CA 94702 and is currently estimated at $1,156,000, approximately $636 per square foot. 1923 Curtis St is a home located in Alameda County with nearby schools including Rosa Parks Elementary School, Ruth Acty Elementary, and Berkeley Arts Magnet at Whittier School.
Ownership History
Date
Name
Owned For
Owner Type
Purchase Details
Closed on
Apr 19, 2014
Sold by
Pappas Nick Aleck and Nick Aleck Pappas Revocable Tr
Bought by
Nick Aleck Pappas and Pappas F Christine Z
Current Estimated Value
Purchase Details
Closed on
Apr 19, 2000
Sold by
Pappas Nick A
Bought by
Pappas Nick Aleck and Nick Aleck Pappas Revocable Tr
Create a Home Valuation Report for This Property
The Home Valuation Report is an in-depth analysis detailing your home's value as well as a comparison with similar homes in the area
Home Values in the Area
Average Home Value in this Area
Purchase History
| Date | Buyer | Sale Price | Title Company |
|---|---|---|---|
| Nick Aleck Pappas | -- | None Available | |
| Pappas Nick Aleck | -- | -- |
Source: Public Records
Tax History
| Year | Tax Paid | Tax Assessment Tax Assessment Total Assessment is a certain percentage of the fair market value that is determined by local assessors to be the total taxable value of land and additions on the property. | Land | Improvement |
|---|---|---|---|---|
| 2025 | $8,685 | $286,397 | $103,590 | $182,807 |
| 2024 | $8,685 | $280,782 | $101,559 | $179,223 |
| 2023 | $8,458 | $275,277 | $99,568 | $175,709 |
| 2022 | $8,202 | $269,880 | $97,616 | $172,264 |
| 2021 | $8,150 | $264,588 | $95,702 | $168,886 |
| 2020 | $7,466 | $261,876 | $94,721 | $167,155 |
| 2019 | $6,900 | $256,742 | $92,864 | $163,878 |
| 2018 | $6,724 | $251,708 | $91,043 | $160,665 |
| 2017 | $6,460 | $246,773 | $89,258 | $157,515 |
| 2016 | $6,073 | $241,935 | $87,508 | $154,427 |
| 2015 | $5,966 | $238,302 | $86,194 | $152,108 |
| 2014 | $6,072 | $233,635 | $84,506 | $149,129 |
Source: Public Records
Map
Nearby Homes
- 1919 Curtis St
- 1261 Hearst Ave
- 1128 Delaware St
- 1728 Curtis St
- 2144 Curtis St
- 1322 Virginia St
- 2013 9th St
- 1631 Belvedere Ave
- 1411 Hearst Ave Unit 2
- 2231 Byron St
- 940 Delaware St
- 995 Virginia St
- 1813 Sacramento St
- 2241 Ninth St
- 2324 Browning St
- 2327 10th St Unit 4
- 1050 Allston Way
- 931 Bancroft Way
- 1039 Channing Way
- 2118 California St
- 1923 Curtis St Unit 1927
- 1919 Curtis St Unit 9
- 1919 Curtis St Unit 7
- 1919 Curtis St Unit 10
- 1211 University Ave
- 1917 Curtis St
- 1207 University Ave
- 1915 Curtis St
- 1219 University Ave
- 1215 University Ave
- 1980 Curtis St
- 1913 Curtis St
- 1227 University Ave
- 1223 University Ave
- 1907 Curtis St
- 1238 Hearst Ave
- 1187 University Ave
- 1231 University Ave
- 1233 University Ave
- 1246 Hearst Ave
Your Personal Tour Guide
Ask me questions while you tour the home.