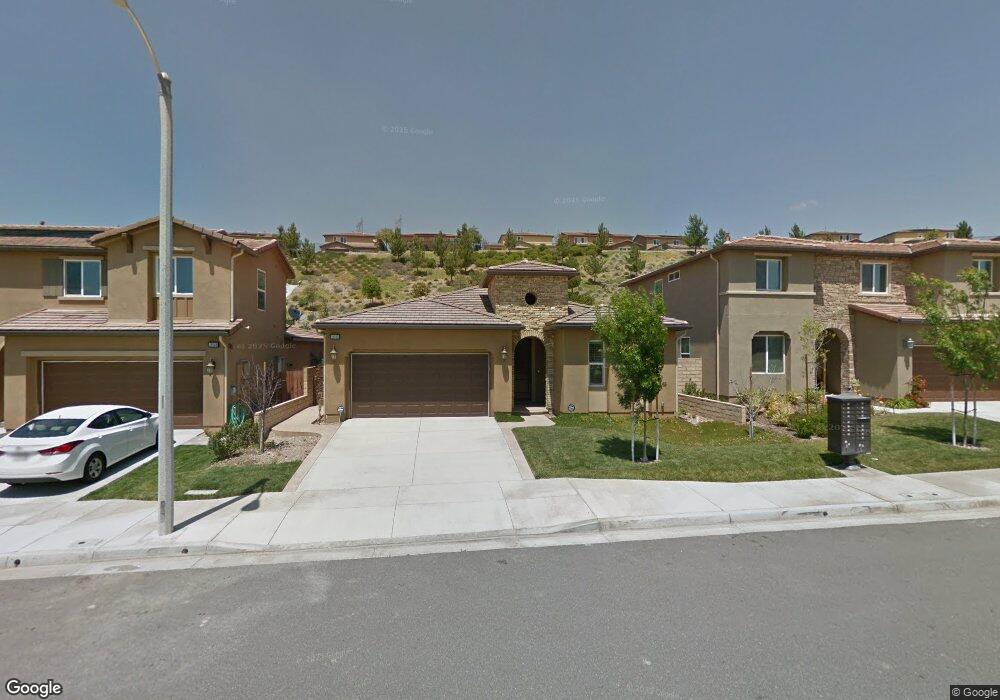
19243 Carranza Ln Santa Clarita, CA 91350
Estimated Value: $855,000 - $944,000
3
Beds
2
Baths
1,964
Sq Ft
$461/Sq Ft
Est. Value
About This Home
This home is located at 19243 Carranza Ln, Santa Clarita, CA 91350 and is currently estimated at $906,019, approximately $461 per square foot. 19243 Carranza Ln is a home with nearby schools including Plum Canyon Elementary School, Arroyo Seco Junior High School, and Saugus High School.
Ownership History
Date
Name
Owned For
Owner Type
Purchase Details
Closed on
Oct 30, 2017
Sold by
Koffman Martha Ann
Bought by
Koffman Martha A and Koffman Trust
Current Estimated Value
Purchase Details
Closed on
Jul 5, 2012
Sold by
Plum Canyon Master Llc
Bought by
Koffman Martha Ann
Home Financials for this Owner
Home Financials are based on the most recent Mortgage that was taken out on this home.
Original Mortgage
$347,352
Outstanding Balance
$239,318
Interest Rate
3.63%
Mortgage Type
New Conventional
Estimated Equity
$666,701
Purchase Details
Closed on
May 31, 2012
Sold by
Duvardo Jeffrey Lee
Bought by
Koffman Martha Ann
Home Financials for this Owner
Home Financials are based on the most recent Mortgage that was taken out on this home.
Original Mortgage
$347,352
Outstanding Balance
$239,318
Interest Rate
3.63%
Mortgage Type
New Conventional
Estimated Equity
$666,701
Purchase Details
Closed on
Dec 30, 2009
Sold by
Monteverde Development Co
Bought by
287 Pcs Llc
Create a Home Valuation Report for This Property
The Home Valuation Report is an in-depth analysis detailing your home's value as well as a comparison with similar homes in the area
Home Values in the Area
Average Home Value in this Area
Purchase History
| Date | Buyer | Sale Price | Title Company |
|---|---|---|---|
| Koffman Martha A | -- | None Available | |
| Koffman Martha Ann | $434,500 | Fidelity National Title Co | |
| Koffman Martha Ann | -- | Fidelity National Title Co | |
| 287 Pcs Llc | $24,109,937 | Fidelity Natl Title Ins Co |
Source: Public Records
Mortgage History
| Date | Status | Borrower | Loan Amount |
|---|---|---|---|
| Open | Koffman Martha Ann | $347,352 |
Source: Public Records
Tax History Compared to Growth
Tax History
| Year | Tax Paid | Tax Assessment Tax Assessment Total Assessment is a certain percentage of the fair market value that is determined by local assessors to be the total taxable value of land and additions on the property. | Land | Improvement |
|---|---|---|---|---|
| 2025 | $7,769 | $564,485 | $246,282 | $318,203 |
| 2024 | $7,769 | $553,417 | $241,453 | $311,964 |
| 2023 | $7,467 | $542,567 | $236,719 | $305,848 |
| 2022 | $7,455 | $531,929 | $232,078 | $299,851 |
| 2021 | $7,327 | $521,500 | $227,528 | $293,972 |
| 2019 | $7,077 | $506,033 | $220,780 | $285,253 |
| 2018 | $6,653 | $496,111 | $216,451 | $279,660 |
| 2017 | $6,530 | $486,384 | $212,207 | $274,177 |
| 2016 | $6,287 | $476,848 | $208,047 | $268,801 |
| 2015 | $6,068 | $469,686 | $204,922 | $264,764 |
| 2014 | $5,558 | $419,897 | $200,908 | $218,989 |
Source: Public Records
Map
Nearby Homes
- 19033 Graham Ln
- 19537 Griffith Dr
- 19038 Carranza Ln
- 19515 Lanfranca Dr
- 19415 Opal Ln
- 19451 Opal Ln Unit 276
- 28440 Casselman Ln Unit 361
- 28365 Casselman Ln
- 28427 Casselman Ln
- 18952 Lauren Ln
- 28378 Mirabelle Ln
- 19133 Malabar St
- 28468 Santa Rosa Ln Unit 534
- 19127 Malabar St
- 19347 Laroda Ln
- 28385 Mirabelle Ln
- 28381 Mirabelle Ln Unit 496
- 28454 Santa Rosa Ln
- 19230 Blackthorn Dr
- 19512 Laroda Ln Unit 212
- 19237 Carranza Ln
- 19249 Carranza Ln
- 19231 Carranza Ln
- 19255 Carranza Ln
- 19246 Carranza Ln
- 19225 Carranza Ln
- 19240 Carranza Ln
- 19301 Carranza Ln
- 19234 Carranza Ln
- 19252 Carranza Ln
- 19228 Carranza Ln
- 19221 Carranza Ln
- 19307 Carranza Ln
- 19302 W Carranza Ln
- 19302 Carranza Ln
- 19222 Carranza Ln
- 19308 Carranza Ln
- 19238 Graham Ln
- 19215 Carranza Ln
- 19311 Carranza Ln