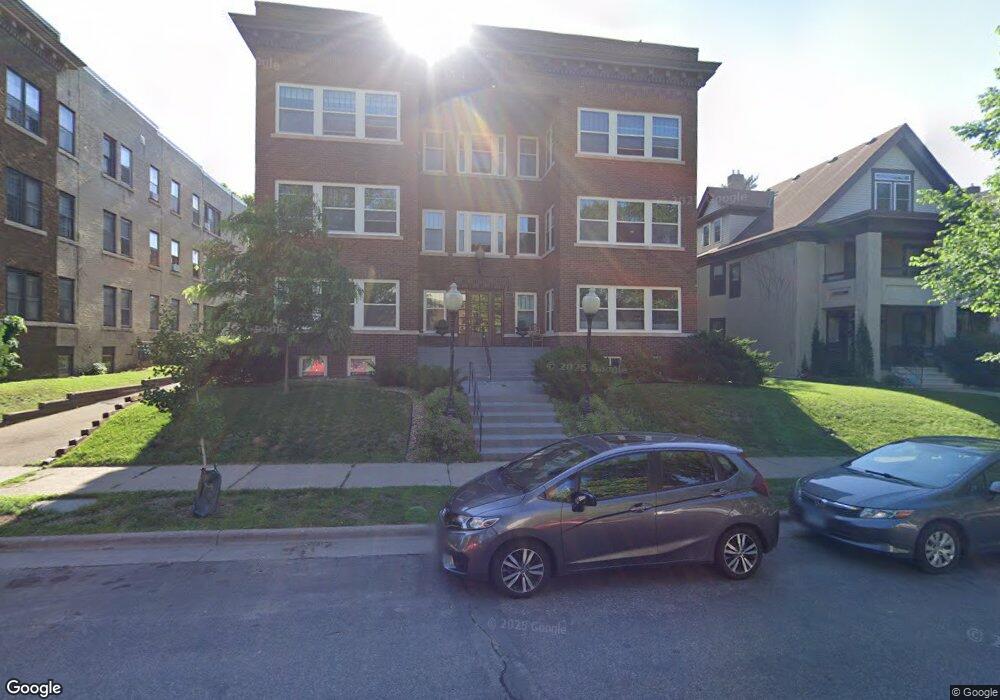
1925 Dupont Ave S Unit 13 Minneapolis, MN 55403
Lowry Hill NeighborhoodEstimated Value: $352,000 - $380,000
3
Beds
1
Bath
1,650
Sq Ft
$224/Sq Ft
Est. Value
About This Home
This home is located at 1925 Dupont Ave S Unit 13, Minneapolis, MN 55403 and is currently estimated at $369,291, approximately $223 per square foot. 1925 Dupont Ave S Unit 13 is a home located in Hennepin County with nearby schools including Kenwood Elementary School, Anwatin Middle School, and North High School.
Ownership History
Date
Name
Owned For
Owner Type
Purchase Details
Closed on
Jun 13, 2016
Sold by
Couture Troy D and Couture Holly S
Bought by
Ferguson Scott S and Ferguson Laura F
Current Estimated Value
Home Financials for this Owner
Home Financials are based on the most recent Mortgage that was taken out on this home.
Original Mortgage
$200,000
Interest Rate
3.48%
Mortgage Type
New Conventional
Purchase Details
Closed on
Aug 22, 2008
Sold by
Pontaut Frederick and Pontaut Susan
Bought by
Couture Troy D and Couture Holly S
Purchase Details
Closed on
Oct 4, 2002
Sold by
Keenan Joseph and Keenan Shannon
Bought by
Pontaut Frederic and Tongren Susan
Purchase Details
Closed on
Apr 25, 1997
Sold by
Kessler Robert E
Bought by
Keenan Joseph P and Keenan Shannon T
Purchase Details
Closed on
May 16, 1996
Sold by
Knutson Kimary S
Bought by
Kessler Robert E
Create a Home Valuation Report for This Property
The Home Valuation Report is an in-depth analysis detailing your home's value as well as a comparison with similar homes in the area
Home Values in the Area
Average Home Value in this Area
Purchase History
| Date | Buyer | Sale Price | Title Company |
|---|---|---|---|
| Ferguson Scott S | $340,000 | Burnet Title | |
| Couture Troy D | $290,000 | -- | |
| Pontaut Frederic | $258,000 | -- | |
| Keenan Joseph P | $144,900 | -- | |
| Kessler Robert E | $138,000 | -- |
Source: Public Records
Mortgage History
| Date | Status | Borrower | Loan Amount |
|---|---|---|---|
| Previous Owner | Ferguson Scott S | $200,000 |
Source: Public Records
Tax History Compared to Growth
Tax History
| Year | Tax Paid | Tax Assessment Tax Assessment Total Assessment is a certain percentage of the fair market value that is determined by local assessors to be the total taxable value of land and additions on the property. | Land | Improvement |
|---|---|---|---|---|
| 2024 | $5,248 | $354,000 | $31,000 | $323,000 |
| 2023 | $4,768 | $366,000 | $35,000 | $331,000 |
| 2022 | $4,697 | $349,000 | $35,000 | $314,000 |
| 2021 | $4,124 | $339,000 | $35,000 | $304,000 |
| 2020 | $4,699 | $308,000 | $23,700 | $284,300 |
| 2019 | $4,608 | $324,000 | $23,700 | $300,300 |
| 2018 | $4,335 | $308,500 | $23,700 | $284,800 |
| 2017 | $3,864 | $251,000 | $23,700 | $227,300 |
| 2016 | $3,844 | $242,000 | $23,700 | $218,300 |
| 2015 | $4,031 | $242,000 | $23,700 | $218,300 |
| 2014 | -- | $231,500 | $23,700 | $207,800 |
Source: Public Records
Map
Nearby Homes
- 1940 Dupont Ave S
- 1932 Dupont Ave S
- 1901 Emerson Ave S Unit 402
- 1901 Emerson Ave S Unit 104
- 1820 Colfax Ave S
- 910 Lincoln Ave Unit B4
- 1915 Fremont Ave S
- 2112 Emerson Ave S Unit 3
- 904 W 22nd St
- 1785 Dupont Ave S
- 1805 Fremont Ave S
- 2021 Girard Ave S
- 1770 Bryant Ave S Unit 114
- 821 Douglas Ave Unit 204
- 1767 Fremont Ave S
- 1212 Douglas Ave
- 2100 Garfield Ave Unit 3
- 2316 Aldrich Ave S
- 1308 W 24th St
- 1721 Humboldt Ave S Unit 1
- 1925 Dupont Ave S Unit 5
- 1925 Dupont Ave S Unit 17
- 1925 Dupont Ave S Unit 16
- 1925 Dupont Ave S Unit 15
- 1925 Dupont Ave S Unit 14
- 1925 Dupont Ave S Unit 12
- 1925 Dupont Ave S Unit 11
- 1925 Dupont Ave S Unit 10
- 1925 Dupont Ave S
- 1925 Dupont Ave S Unit A
- 1925 Dupont Ave S Unit 6
- 1925 Dupont Ave S Unit 1
- 1925 Dupont Ave S Unit 4
- 1925 1925 Dupont-Avenue-s
- 1925 1925 Dupont Ave S
- 1929 Dupont Ave S
- 1931 Dupont Ave S
- 1919 Dupont Ave S
- 1933 Dupont Ave S
- 1912 1912 Dupont-Avenue-s