Estimated Value: $440,921 - $479,000
4
Beds
4
Baths
2,760
Sq Ft
$168/Sq Ft
Est. Value
About This Home
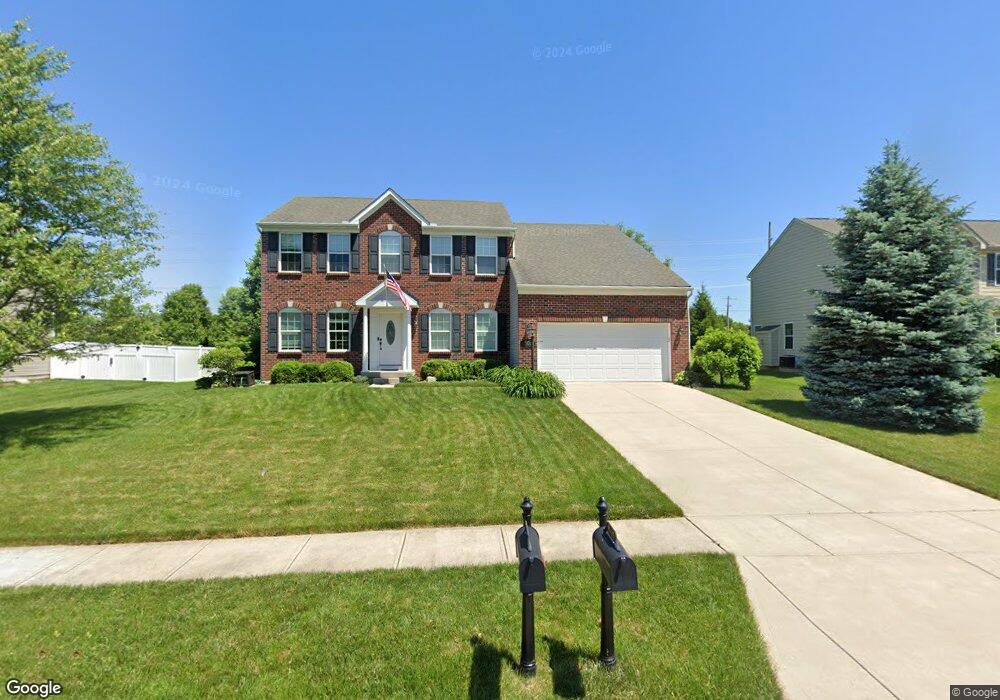
This home is located at 1926 Red Robin Dr N, Xenia, OH 45385 and is currently estimated at $462,730, approximately $167 per square foot. 1926 Red Robin Dr N is a home located in Greene County with nearby schools including Trebein Elementary School, Jacob Coy Middle School, and Beavercreek High School.
Ownership History
Date
Name
Owned For
Owner Type
Purchase Details
Closed on
Jul 22, 2019
Sold by
Turner Ricky A and Turner Karen M
Bought by
Deluca Billie and Deluca Robert
Current Estimated Value
Home Financials for this Owner
Home Financials are based on the most recent Mortgage that was taken out on this home.
Original Mortgage
$326,880
Outstanding Balance
$286,376
Interest Rate
3.82%
Mortgage Type
VA
Estimated Equity
$176,354
Purchase Details
Closed on
Jul 6, 2010
Sold by
Nvr Inc
Bought by
Turner Ricky A and Turner Karen M
Home Financials for this Owner
Home Financials are based on the most recent Mortgage that was taken out on this home.
Original Mortgage
$227,488
Interest Rate
4.83%
Mortgage Type
VA
Purchase Details
Closed on
Apr 8, 2010
Sold by
Oberer Land Developers Ltd
Bought by
Nvr Inc
Create a Home Valuation Report for This Property
The Home Valuation Report is an in-depth analysis detailing your home's value as well as a comparison with similar homes in the area
Home Values in the Area
Average Home Value in this Area
Purchase History
| Date | Buyer | Sale Price | Title Company |
|---|---|---|---|
| Deluca Billie | $320,000 | None Available | |
| Turner Ricky A | $222,700 | None Available | |
| Nvr Inc | $52,500 | None Available |
Source: Public Records
Mortgage History
| Date | Status | Borrower | Loan Amount |
|---|---|---|---|
| Open | Deluca Billie | $326,880 | |
| Previous Owner | Turner Ricky A | $227,488 |
Source: Public Records
Tax History Compared to Growth
Tax History
| Year | Tax Paid | Tax Assessment Tax Assessment Total Assessment is a certain percentage of the fair market value that is determined by local assessors to be the total taxable value of land and additions on the property. | Land | Improvement |
|---|---|---|---|---|
| 2024 | $7,630 | $128,470 | $26,580 | $101,890 |
| 2023 | $7,630 | $128,470 | $26,580 | $101,890 |
| 2022 | $7,308 | $107,400 | $22,140 | $85,260 |
| 2021 | $7,388 | $107,400 | $22,140 | $85,260 |
| 2020 | $7,433 | $107,400 | $22,140 | $85,260 |
| 2019 | $7,221 | $97,540 | $15,540 | $82,000 |
| 2018 | $6,344 | $97,540 | $15,540 | $82,000 |
| 2017 | $6,053 | $97,540 | $15,540 | $82,000 |
| 2016 | $5,974 | $90,020 | $15,540 | $74,480 |
| 2015 | $6,020 | $90,020 | $15,540 | $74,480 |
| 2014 | $5,898 | $90,020 | $15,540 | $74,480 |
Source: Public Records
Map
Nearby Homes
- 1922 Spring Ridge Dr
- 1878 Spring Meadows Dr
- 1788 Fawnwood Ct
- 1105 Windsong Trail
- 1281 Whitetail Dr
- 508 Glenhaven Way Unit 756-300
- 516 Glenhaven Way Unit 756-304
- 506 Glenhaven Way Unit 756-204
- 502 Glenhaven Way Unit 756-202
- 510 Glenhaven Way Unit 756-301
- 500 Glenhaven Way Unit 756-201
- 456 Glenhaven Way Unit 754-304
- 464 Glenhaven Way Unit 755-203
- 474 Glenhaven Way Unit 755-303
- 518 Glenhaven Way Unit 756-305
- 470 Glenhaven Way Unit 755-301
- 462 Glenhaven Way Unit 755-202
- 2657 Verdant Ln Unit 759-304
- 2655 Verdant Ln Unit 759-303
- 2659 Verdant Ln Unit 759-305
- 1918 Red Robin Dr N
- 1932 Red Robin Dr N
- 1942 N Red Robin Dr
- 1942 S Red Robin Dr
- 2935 April Ln
- 1933 Red Robin Dr N
- 1943 Red Robin Dr N
- 1952 Red Robin Dr N
- 2929 April Ln
- 2954 April Ln
- 2944 April Ln
- 2987 April Ln
- 1921 Spring Ridge Dr
- 1953 Red Robin Dr N
- 1929 Spring Ridge Dr
- 1924 Red Robin Dr S
- 2938 April Ln
- 1937 Spring Ridge Dr
- 1934 Red Robin Dr S
- 1962 Red Robin Dr N