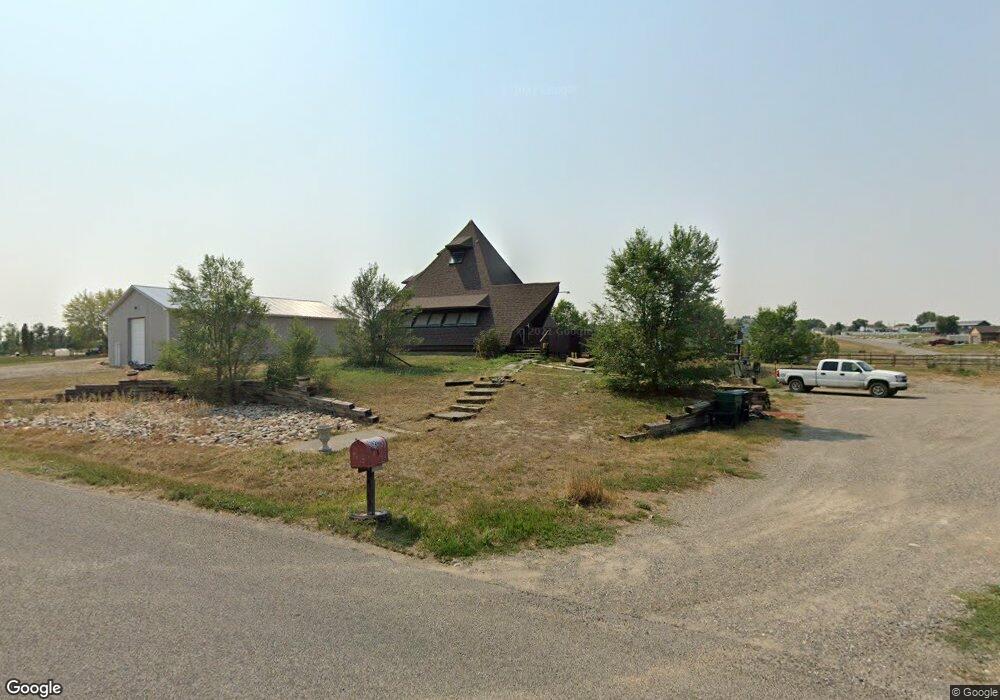
1926 Sagebrush Rd Billings, MT 59105
Billings Heights NeighborhoodEstimated Value: $346,000 - $400,000
3
Beds
1
Bath
3,280
Sq Ft
$114/Sq Ft
Est. Value
About This Home
This home is located at 1926 Sagebrush Rd, Billings, MT 59105 and is currently estimated at $374,394, approximately $114 per square foot. 1926 Sagebrush Rd is a home located in Yellowstone County with nearby schools including Independent Elementary School, Castle Rock Junior High School, and Skyview High School.
Ownership History
Date
Name
Owned For
Owner Type
Purchase Details
Closed on
May 12, 2020
Sold by
Post Candyce
Bought by
Lewis James R
Current Estimated Value
Home Financials for this Owner
Home Financials are based on the most recent Mortgage that was taken out on this home.
Original Mortgage
$181,818
Outstanding Balance
$161,716
Interest Rate
3.5%
Mortgage Type
New Conventional
Estimated Equity
$212,678
Purchase Details
Closed on
Nov 6, 2013
Sold by
Andersen Albert B and Andersen Debra A
Bought by
Post Candyce
Home Financials for this Owner
Home Financials are based on the most recent Mortgage that was taken out on this home.
Original Mortgage
$93,593
Interest Rate
4.27%
Mortgage Type
Future Advance Clause Open End Mortgage
Purchase Details
Closed on
Dec 20, 2006
Sold by
Andersen Albert B
Bought by
Andersen Albert B and Andersen Debra A
Purchase Details
Closed on
Nov 8, 2006
Sold by
Montana Yellowstone Southern Baptist Ass
Bought by
Andersen Albert B
Create a Home Valuation Report for This Property
The Home Valuation Report is an in-depth analysis detailing your home's value as well as a comparison with similar homes in the area
Home Values in the Area
Average Home Value in this Area
Purchase History
| Date | Buyer | Sale Price | Title Company |
|---|---|---|---|
| Lewis James R | -- | First Montana Title Co | |
| Post Candyce | -- | None Available | |
| Andersen Albert B | -- | None Available | |
| Andersen Albert B | -- | None Available |
Source: Public Records
Mortgage History
| Date | Status | Borrower | Loan Amount |
|---|---|---|---|
| Open | Lewis James R | $181,818 | |
| Previous Owner | Post Candyce | $93,593 |
Source: Public Records
Tax History Compared to Growth
Tax History
| Year | Tax Paid | Tax Assessment Tax Assessment Total Assessment is a certain percentage of the fair market value that is determined by local assessors to be the total taxable value of land and additions on the property. | Land | Improvement |
|---|---|---|---|---|
| 2025 | $2,510 | $334,000 | $71,291 | $262,709 |
| 2024 | $2,510 | $312,300 | $57,028 | $255,272 |
| 2023 | $2,607 | $312,300 | $57,028 | $255,272 |
| 2022 | $2,102 | $222,100 | $0 | $0 |
| 2021 | $2,105 | $222,100 | $0 | $0 |
| 2020 | $2,059 | $219,900 | $0 | $0 |
| 2019 | $2,540 | $219,900 | $0 | $0 |
| 2018 | $2,458 | $193,400 | $0 | $0 |
| 2017 | $2,477 | $193,400 | $0 | $0 |
| 2016 | $2,343 | $190,100 | $0 | $0 |
| 2015 | $2,241 | $190,100 | $0 | $0 |
| 2014 | $2,009 | $81,100 | $0 | $0 |
Source: Public Records
Map
Nearby Homes
- 2719 Strapper Ln
- 2737 Strapper Ln
- 2738 Strapper Ln
- 2743 Strapper Ln
- 2731 Strapper Ln
- 1364 W Eugene Ave
- 2612 Palmer Ln
- 1395 W Eugene Ave
- 2647 Palmer Ln
- 2635 Palmer Ln
- 2641 Palmer Ln
- 2623 Palmer Ln
- 2624 Palmer Ln
- 2617 Palmer Ln
- 1371 W Eugene Ave
- 1384 W Eugene Ave
- 1385 W Eugene Ave
- 2618 Palmer Ln
- 2629 Palmer Ln
- 2648 Palmer Ln
- 3714 Barry Dr
- 1910 Sagebrush Rd
- 3739 Barry Dr
- 3710 Barry Dr
- 3807 Sagebrush Dr
- 3802 Barry Dr
- 3713 Clint Rd
- 3701 Clint Rd
- 3815 Sagebrush Dr
- 3807 Clint Rd
- 3831 Sagebrush Dr
- 3723 Blue Stem Place
- 3823 Sagebrush Dr
- 3707 Blue Stem Place
- 3650 Barry Dr
- 3744 Clint Rd
- 3843 Barry Dr
- 3818 Barry Dr
- 3651 Clint Rd
- 3718 Clint Rd