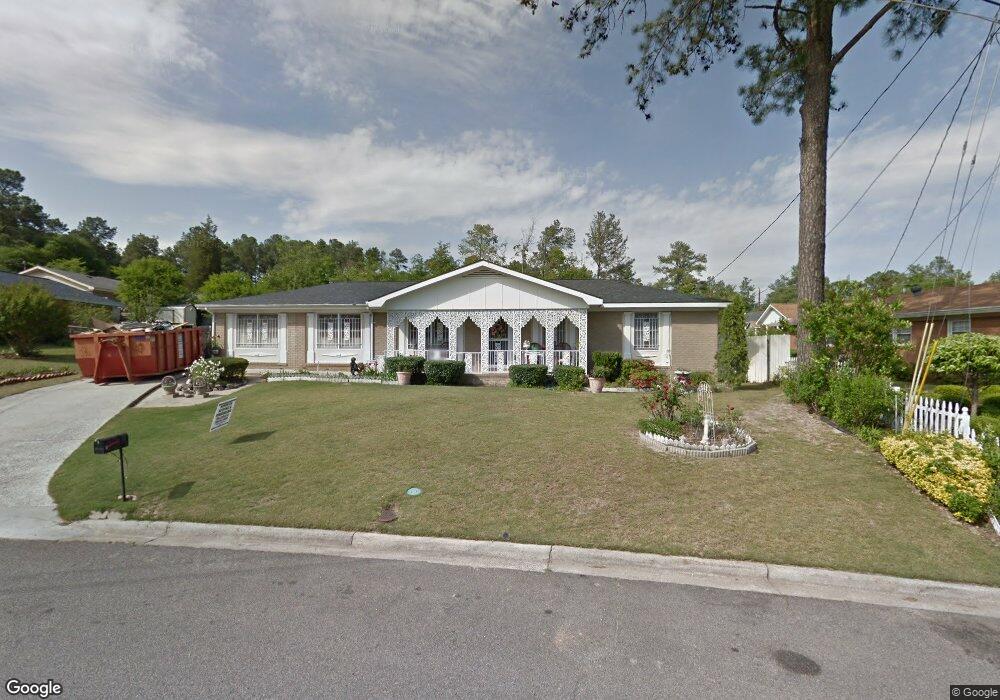
1926 Valley Spring Rd Augusta, GA 30909
North Leg NeighborhoodEstimated Value: $210,000 - $241,000
4
Beds
3
Baths
2,135
Sq Ft
$108/Sq Ft
Est. Value
About This Home
This home is located at 1926 Valley Spring Rd, Augusta, GA 30909 and is currently estimated at $229,887, approximately $107 per square foot. 1926 Valley Spring Rd is a home located in Richmond County with nearby schools including R.B. Hunt Elementary School, Copeland Elementary School, and Langford Middle School.
Create a Home Valuation Report for This Property
The Home Valuation Report is an in-depth analysis detailing your home's value as well as a comparison with similar homes in the area
Home Values in the Area
Average Home Value in this Area
Tax History Compared to Growth
Tax History
| Year | Tax Paid | Tax Assessment Tax Assessment Total Assessment is a certain percentage of the fair market value that is determined by local assessors to be the total taxable value of land and additions on the property. | Land | Improvement |
|---|---|---|---|---|
| 2025 | $1,056 | $82,064 | $10,400 | $71,664 |
| 2024 | $1,056 | $84,508 | $10,400 | $74,108 |
| 2023 | $1,030 | $81,004 | $10,400 | $70,604 |
| 2022 | $968 | $65,310 | $10,400 | $54,910 |
| 2021 | $990 | $61,173 | $10,400 | $50,773 |
| 2020 | $890 | $52,150 | $8,000 | $44,150 |
| 2019 | $944 | $53,683 | $8,000 | $45,683 |
| 2018 | $949 | $53,683 | $8,000 | $45,683 |
| 2017 | $898 | $53,683 | $8,000 | $45,683 |
| 2016 | $899 | $53,683 | $8,000 | $45,683 |
| 2015 | $962 | $53,683 | $8,000 | $45,683 |
| 2014 | $864 | $45,987 | $8,000 | $37,987 |
Source: Public Records
Map
Nearby Homes
- 3009 Bramble Wood Trail
- 3242 Summerchase Cir
- 1910 Aspen Green Way
- 1817 Sibley Rd
- 2016 Westfield Dr Unit R
- 2154 Bayvale Rd
- 2149 NW Veterans Dr
- 3013 Cardinal Dr
- 1719 Fairwood Ct
- 1715 Fairwood Dr
- 600 Bransford Rd
- 3134 Switzer Dr
- 1426 Springview Dr
- 3317 Forest Estates Dr
- 1708 Sandalwood Dr
- 3427 Heather Dr
- 1415 Springview Dr
- 3160 Donald Rd
- 2242 Wheeless Rd
- 2036 Ohio Ave
- 1905 Graymont Dr
- 1924 Valley Spring Rd
- 3016 Bramble Wood Trail
- 1929 Valley Spring Rd
- 1903 Graymont Dr
- 3012 Bramble Wood Trail
- 3014 Bramble Wood Trail
- 1931 Valley Spring Rd
- 3010 Bramble Wood Trail
- 3025 Bramble Wood Trail
- 1910 Graymont Dr
- 1908 Graymont Dr
- 1930 Valley Spring Rd
- 3022 Bramble Wood Trail
- 3023 Bramble Wood Trail
- 1933 Valley Spring Rd
- 1906 Graymont Dr
- 1927 Valley Spring Rd
- 2225 Belair Spring Rd