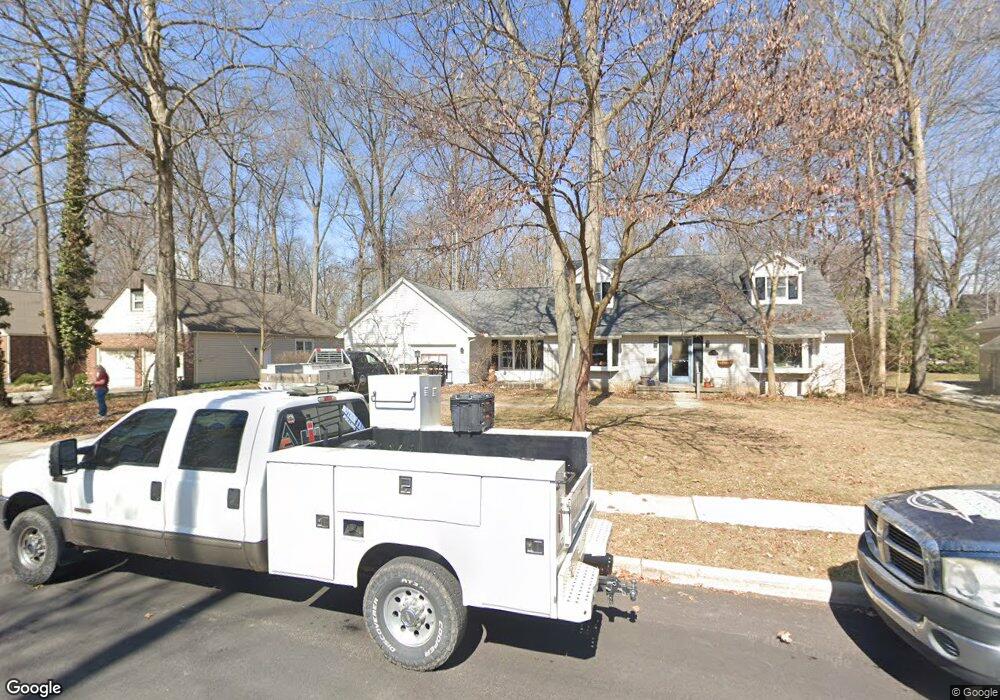
1926 Windsor Place Findlay, OH 45840
Estimated Value: $348,000 - $395,000
4
Beds
3
Baths
2,314
Sq Ft
$160/Sq Ft
Est. Value
About This Home
This home is located at 1926 Windsor Place, Findlay, OH 45840 and is currently estimated at $371,059, approximately $160 per square foot. 1926 Windsor Place is a home located in Hancock County with nearby schools including Wilson Vance Elementary School, Whittier Elementary School, and Donnell Middle School.
Ownership History
Date
Name
Owned For
Owner Type
Purchase Details
Closed on
Apr 13, 2001
Sold by
Mcfarlane Michael J
Bought by
Dryden David M and Dryden Lisa L
Current Estimated Value
Home Financials for this Owner
Home Financials are based on the most recent Mortgage that was taken out on this home.
Original Mortgage
$156,000
Outstanding Balance
$57,636
Interest Rate
7.05%
Mortgage Type
New Conventional
Estimated Equity
$313,423
Purchase Details
Closed on
Jun 26, 1998
Sold by
Fitzpatrick Thomas
Bought by
Mcfarlene Michael and Mcfarlene Mary
Home Financials for this Owner
Home Financials are based on the most recent Mortgage that was taken out on this home.
Original Mortgage
$180,000
Interest Rate
7.27%
Mortgage Type
New Conventional
Purchase Details
Closed on
Jun 28, 1991
Bought by
Fitzpatrick Thomas N
Purchase Details
Closed on
May 6, 1985
Bought by
Coats James H
Purchase Details
Closed on
Aug 23, 1982
Bought by
Coats James H and Coats Jacqueline
Create a Home Valuation Report for This Property
The Home Valuation Report is an in-depth analysis detailing your home's value as well as a comparison with similar homes in the area
Home Values in the Area
Average Home Value in this Area
Purchase History
| Date | Buyer | Sale Price | Title Company |
|---|---|---|---|
| Dryden David M | $195,000 | -- | |
| Mcfarlene Michael | $200,000 | -- | |
| Fitzpatrick Thomas N | $156,500 | -- | |
| Coats James H | -- | -- | |
| Coats James H | $120,000 | -- |
Source: Public Records
Mortgage History
| Date | Status | Borrower | Loan Amount |
|---|---|---|---|
| Open | Dryden David M | $156,000 | |
| Previous Owner | Mcfarlene Michael | $180,000 |
Source: Public Records
Tax History
| Year | Tax Paid | Tax Assessment Tax Assessment Total Assessment is a certain percentage of the fair market value that is determined by local assessors to be the total taxable value of land and additions on the property. | Land | Improvement |
|---|---|---|---|---|
| 2024 | $3,924 | $110,420 | $11,900 | $98,520 |
| 2023 | $3,930 | $110,420 | $11,900 | $98,520 |
| 2022 | $3,916 | $110,420 | $11,900 | $98,520 |
| 2021 | $3,570 | $87,710 | $11,410 | $76,300 |
| 2020 | $3,570 | $87,710 | $11,410 | $76,300 |
| 2019 | $3,498 | $87,710 | $11,410 | $76,300 |
| 2018 | $3,513 | $80,820 | $11,410 | $69,410 |
| 2017 | $3,515 | $80,820 | $11,410 | $69,410 |
| 2016 | $3,454 | $80,820 | $11,410 | $69,410 |
| 2015 | $3,213 | $73,460 | $11,410 | $62,050 |
| 2014 | $3,213 | $73,460 | $11,410 | $62,050 |
| 2012 | $3,234 | $73,460 | $11,410 | $62,050 |
Source: Public Records
Map
Nearby Homes
- 1900 Imperial Ln
- 630 Winterhaven Dr
- 1121 Fox Run Rd
- 845 Fox Run Rd Unit 1
- 1203 Chateau Ct
- 400 Chase Rd
- 2533 Foxfire Ln
- 456 Strathaven Dr
- 1642 Cherry Ln
- 1308 Greendale Ave
- 100 Warrington Ave
- 300 W Sawmill Rd
- 1726 Cherry Ln
- 701 Red Fox Rd
- 1421 E Sandusky St
- 0 Bright Rd Unit 6117142
- 0 Bright Rd Unit 6117138
- 0 Bright Rd Unit 6117143
- 0 Bright Rd Unit 6117148
- 1450 Fostoria Ave
- 1920 Windsor Place
- 1932 Windsor Place
- 1929 Imperial Ln
- 1933 Imperial Ln
- 1939 Imperial Ln
- 1923 Imperial Ln
- 1925 Windsor Place
- 1914 Windsor Place
- 2000 Windsor Place
- 2001 Imperial Ln
- 1917 Imperial Ln
- 1915 Windsor Place
- 415 Brentwood Ct
- 1908 Windsor Place
- 2005 Imperial Ln
- 2008 Windsor Place
- 408 Brentwood Ct
- 1938 Imperial Ln
- 1909 Imperial Ln
- 2009 Imperial Ln
Your Personal Tour Guide
Ask me questions while you tour the home.