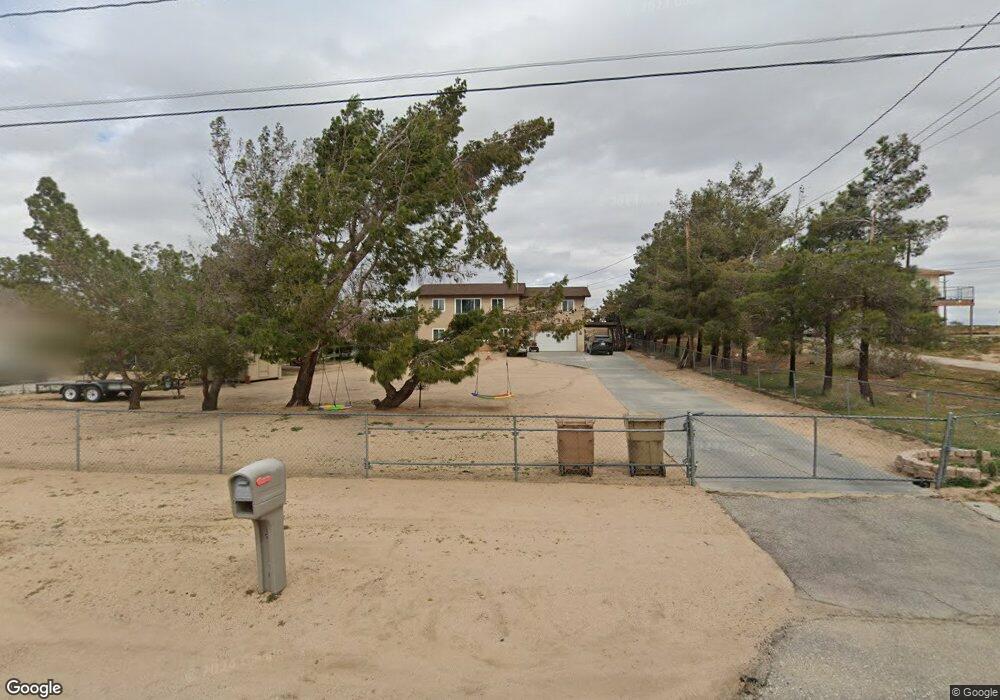
19268 Madrone St Hesperia, CA 92345
The Mesa NeighborhoodEstimated Value: $442,473 - $494,000
4
Beds
2
Baths
2,020
Sq Ft
$232/Sq Ft
Est. Value
About This Home
This home is located at 19268 Madrone St, Hesperia, CA 92345 and is currently estimated at $468,868, approximately $232 per square foot. 19268 Madrone St is a home located in San Bernardino County with nearby schools including Carmel Elementary School, Ranchero Middle School, and Sultana High School.
Ownership History
Date
Name
Owned For
Owner Type
Purchase Details
Closed on
Sep 15, 2005
Sold by
Leseman Tina
Bought by
Leseman Mark D
Current Estimated Value
Home Financials for this Owner
Home Financials are based on the most recent Mortgage that was taken out on this home.
Original Mortgage
$189,000
Outstanding Balance
$100,861
Interest Rate
5.81%
Mortgage Type
New Conventional
Estimated Equity
$368,007
Purchase Details
Closed on
May 5, 2004
Sold by
Leseman Mark D
Bought by
Leseman Mark D
Home Financials for this Owner
Home Financials are based on the most recent Mortgage that was taken out on this home.
Original Mortgage
$132,600
Interest Rate
6.75%
Mortgage Type
New Conventional
Purchase Details
Closed on
Aug 10, 2000
Sold by
Gerald George Paul Trust and George Gerald
Bought by
Leseman Mark D
Home Financials for this Owner
Home Financials are based on the most recent Mortgage that was taken out on this home.
Original Mortgage
$66,750
Interest Rate
8.07%
Mortgage Type
Balloon
Purchase Details
Closed on
Jul 17, 2000
Sold by
Rensen Tonita L
Bought by
Paul Gerald George and Gerald George Paul Trust
Home Financials for this Owner
Home Financials are based on the most recent Mortgage that was taken out on this home.
Original Mortgage
$66,750
Interest Rate
8.07%
Mortgage Type
Balloon
Purchase Details
Closed on
Apr 16, 1999
Sold by
Paul Joan M
Bought by
Paul Gerald George
Purchase Details
Closed on
Sep 1, 1998
Sold by
Gerald George Paul Trust and George Gerald
Bought by
Rensen Tonita L
Home Financials for this Owner
Home Financials are based on the most recent Mortgage that was taken out on this home.
Original Mortgage
$84,400
Interest Rate
6.98%
Mortgage Type
Seller Take Back
Purchase Details
Closed on
Apr 25, 1996
Sold by
Paul Gerald G
Bought by
Gerald George Paul Trust
Purchase Details
Closed on
Mar 15, 1996
Sold by
Paul Gerald G
Bought by
Paul Gerald G
Purchase Details
Closed on
Feb 26, 1996
Sold by
Ferris Brent D
Bought by
Paul Gerald G and Paul Joan M
Purchase Details
Closed on
Feb 15, 1996
Sold by
Ferris Brent D
Bought by
Paul Gerald G and Paul Joan M
Purchase Details
Closed on
Nov 16, 1993
Sold by
Paul Gerald G
Bought by
Ferris Brent D and Ferris Corby C
Home Financials for this Owner
Home Financials are based on the most recent Mortgage that was taken out on this home.
Original Mortgage
$88,530
Interest Rate
7.09%
Mortgage Type
Seller Take Back
Create a Home Valuation Report for This Property
The Home Valuation Report is an in-depth analysis detailing your home's value as well as a comparison with similar homes in the area
Home Values in the Area
Average Home Value in this Area
Purchase History
| Date | Buyer | Sale Price | Title Company |
|---|---|---|---|
| Leseman Mark D | -- | United Title San Diego | |
| Leseman Mark D | -- | Fidelity Natl Tustin | |
| Leseman Mark D | $89,000 | First American Title Ins Co | |
| Paul Gerald George | -- | First American Title Ins Co | |
| Paul Gerald George | -- | First American Title Ins Co | |
| Rensen Tonita L | $93,000 | First American Title Ins Co | |
| Gerald George Paul Trust | -- | -- | |
| Paul Gerald G | -- | -- | |
| Paul Gerald G | $106,228 | Northern Counties Title Ins | |
| Paul Gerald G | $106,228 | Northern Counties Title Ins | |
| Ferris Brent D | $99,500 | Continental Lawyers Title Co |
Source: Public Records
Mortgage History
| Date | Status | Borrower | Loan Amount |
|---|---|---|---|
| Open | Leseman Mark D | $189,000 | |
| Closed | Leseman Mark D | $132,600 | |
| Closed | Leseman Mark D | $66,750 | |
| Previous Owner | Rensen Tonita L | $84,400 | |
| Previous Owner | Ferris Brent D | $88,530 | |
| Closed | Ferris Brent D | $5,970 | |
| Closed | Leseman Mark D | $13,350 |
Source: Public Records
Tax History Compared to Growth
Tax History
| Year | Tax Paid | Tax Assessment Tax Assessment Total Assessment is a certain percentage of the fair market value that is determined by local assessors to be the total taxable value of land and additions on the property. | Land | Improvement |
|---|---|---|---|---|
| 2025 | $1,422 | $134,113 | $19,590 | $114,523 |
| 2024 | $1,422 | $131,483 | $19,206 | $112,277 |
| 2023 | $1,406 | $128,904 | $18,829 | $110,075 |
| 2022 | $1,373 | $126,377 | $18,460 | $107,917 |
| 2021 | $1,347 | $123,899 | $18,098 | $105,801 |
| 2020 | $1,331 | $122,628 | $17,912 | $104,716 |
| 2019 | $1,303 | $120,224 | $17,561 | $102,663 |
| 2018 | $1,277 | $117,867 | $17,217 | $100,650 |
| 2017 | $1,254 | $115,555 | $16,879 | $98,676 |
| 2016 | $1,227 | $113,289 | $16,548 | $96,741 |
| 2015 | -- | $111,587 | $16,299 | $95,288 |
| 2014 | $1,193 | $109,401 | $15,980 | $93,421 |
Source: Public Records
Map
Nearby Homes
- 19223 Rocksprings Rd
- 0 Rock Springs Rd Unit HD25231516
- 0 Glendale Ave Unit HD25103572
- 0 Glendale Ave Unit HD25103550
- 8944 Glendale Ave
- 19095 Madrone St
- 9022 Glendale Ave
- 19242 Monterey St
- 19077 Goleta St
- 19158 Live Oak St
- 19180 Monterey St
- 9030 Roble Ave
- 19101 Live Oak St
- 19255 Hinton St
- 19190 Hinton St
- 19242 Westlawn St
- 0 Pinnacle St
- 8412 Glendale Ave
- 19168 Westlawn St
- 19109 Hinton St
- 19252 Madrone St
- 8862 Glendale Ave
- 19267 Rocksprings Rd
- 19251 Rocksprings Rd
- 19267 Rock Springs Rd
- 19238 Madrone St
- 8888 Glendale Ave
- 8820 Glendale Ave
- 19255 Madrone St
- 0 Madrone St
- 19237 Rocksprings Rd
- 19237 Rock Springs Rd
- 19224 Madrone St
- 8806 Glendale Ave
- 8803 Devon Ave
- 3 Glendale Ave
- 1 Glendale Ave
- 19219 Madrone St
- 19206 Madrone St
- 8786 Glendale Ave