1927 5th Ave San Rafael, CA 94901
Sun Valley NeighborhoodEstimated Value: $1,127,000 - $1,293,096
4
Beds
2
Baths
2,232
Sq Ft
$534/Sq Ft
Est. Value
About This Home
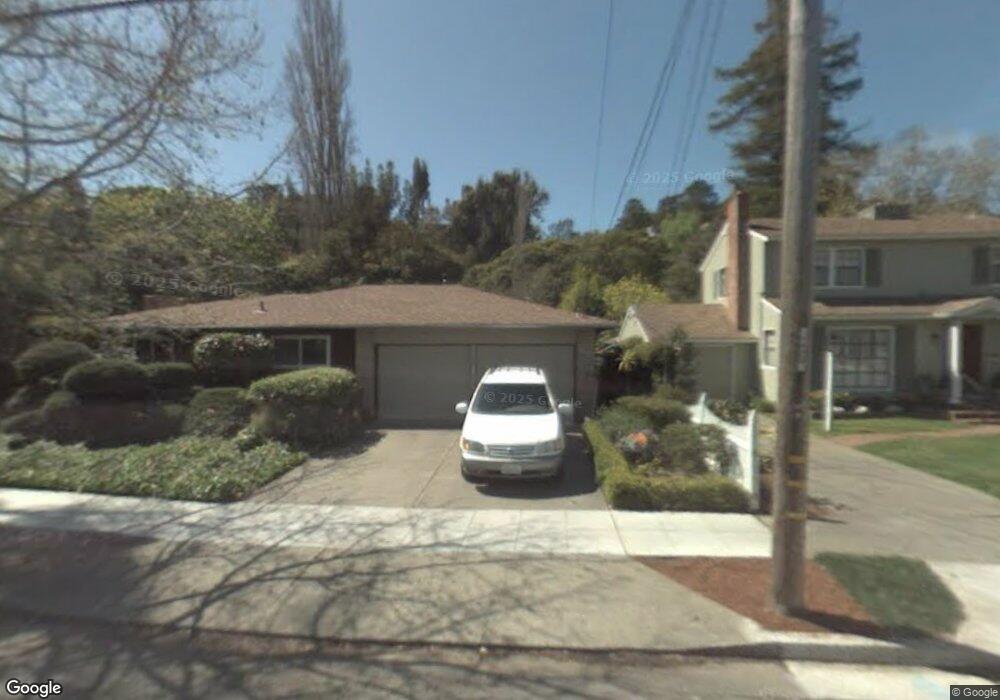
This home is located at 1927 5th Ave, San Rafael, CA 94901 and is currently estimated at $1,192,774, approximately $534 per square foot. 1927 5th Ave is a home located in Marin County with nearby schools including Sun Valley Elementary School, James B. Davidson Middle School, and San Rafael High School.
Ownership History
Date
Name
Owned For
Owner Type
Purchase Details
Closed on
Dec 11, 2019
Sold by
Saia Kathleen J and Saia Sebastian D
Bought by
Saia Sebastian D and Saia Kathleen J
Current Estimated Value
Purchase Details
Closed on
Jul 8, 2010
Sold by
Saia Kathleen J and Saia Sebastian D
Bought by
1927 5Th Avenue Llc
Purchase Details
Closed on
Nov 30, 2006
Sold by
Saia Kathleen J
Bought by
Saia Kathleen J and Saia Sebastian D
Create a Home Valuation Report for This Property
The Home Valuation Report is an in-depth analysis detailing your home's value as well as a comparison with similar homes in the area
Home Values in the Area
Average Home Value in this Area
Purchase History
| Date | Buyer | Sale Price | Title Company |
|---|---|---|---|
| Saia Sebastian D | -- | None Available | |
| Saia Kathleen J | -- | None Available | |
| 1927 5Th Avenue Llc | -- | None Available | |
| Saia Kathleen J | -- | None Available |
Source: Public Records
Tax History Compared to Growth
Tax History
| Year | Tax Paid | Tax Assessment Tax Assessment Total Assessment is a certain percentage of the fair market value that is determined by local assessors to be the total taxable value of land and additions on the property. | Land | Improvement |
|---|---|---|---|---|
| 2025 | $5,312 | $170,636 | $46,581 | $124,055 |
| 2024 | $5,312 | $167,291 | $45,668 | $121,623 |
| 2023 | $5,061 | $164,011 | $44,773 | $119,238 |
| 2022 | $4,904 | $160,796 | $43,895 | $116,901 |
| 2021 | $4,838 | $157,643 | $43,034 | $114,609 |
| 2020 | $4,754 | $156,027 | $42,593 | $113,434 |
| 2019 | $4,462 | $152,969 | $41,758 | $111,211 |
| 2018 | $4,421 | $149,969 | $40,939 | $109,030 |
| 2017 | $4,319 | $147,030 | $40,137 | $106,893 |
| 2016 | $3,993 | $129,417 | $39,338 | $90,079 |
| 2015 | $3,829 | $127,473 | $38,747 | $88,726 |
| 2014 | $3,616 | $124,976 | $37,988 | $86,988 |
Source: Public Records
Map
Nearby Homes