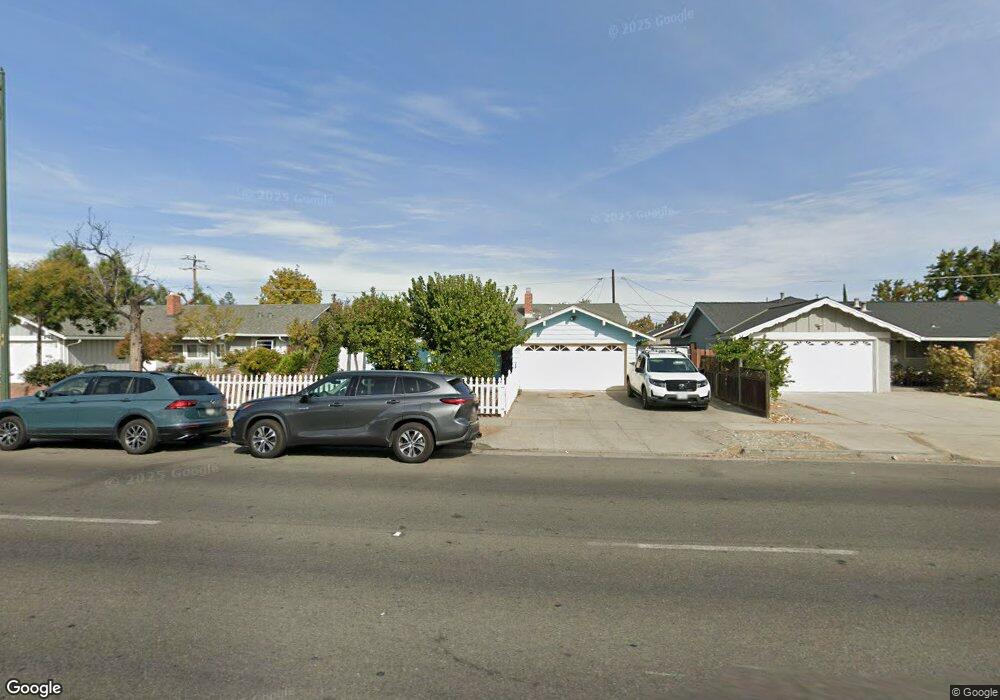
1929 Camden Ave San Jose, CA 95124
Cambrian NeighborhoodEstimated Value: $1,634,000 - $1,739,000
4
Beds
2
Baths
1,280
Sq Ft
$1,314/Sq Ft
Est. Value
About This Home
This home is located at 1929 Camden Ave, San Jose, CA 95124 and is currently estimated at $1,681,352, approximately $1,313 per square foot. 1929 Camden Ave is a home located in Santa Clara County with nearby schools including Branham High School, Fammatre Elementary School, and Sartorette Charter School.
Ownership History
Date
Name
Owned For
Owner Type
Purchase Details
Closed on
May 2, 2020
Sold by
Hsieh Chia Wen and Hua Pei Ling
Bought by
Hsieh Chia Wen and Hua Pei Ling
Current Estimated Value
Purchase Details
Closed on
Jul 8, 2009
Sold by
E E S Residential Group Homes Inc
Bought by
Hsieh Chia Wen and Hua Pei Ling Hsieh
Purchase Details
Closed on
Jun 29, 2009
Sold by
Hua Charles Chen
Bought by
Hua Pei Ling Hsieh
Purchase Details
Closed on
Jan 28, 2000
Sold by
Esmail Alemi and Fariba Mousighi
Bought by
Ees Residential Group Homes Inc
Home Financials for this Owner
Home Financials are based on the most recent Mortgage that was taken out on this home.
Original Mortgage
$252,700
Interest Rate
7.96%
Purchase Details
Closed on
Apr 5, 1994
Sold by
Wisler Charles N
Bought by
Alemi Esmail and Mousighi Fariba
Home Financials for this Owner
Home Financials are based on the most recent Mortgage that was taken out on this home.
Original Mortgage
$152,000
Interest Rate
7.38%
Create a Home Valuation Report for This Property
The Home Valuation Report is an in-depth analysis detailing your home's value as well as a comparison with similar homes in the area
Home Values in the Area
Average Home Value in this Area
Purchase History
| Date | Buyer | Sale Price | Title Company |
|---|---|---|---|
| Hsieh Chia Wen | -- | None Available | |
| Hsieh Chia Wen | $390,000 | Chicago Title Company | |
| Hua Pei Ling Hsieh | -- | Chicago Title Company | |
| Ees Residential Group Homes Inc | $334,000 | Commonwealth Land Title Co | |
| Alemi Esmail | $54,000 | Fidelity National Title | |
| Alemi Esmail | $107,000 | Fidelity National Title |
Source: Public Records
Mortgage History
| Date | Status | Borrower | Loan Amount |
|---|---|---|---|
| Previous Owner | Ees Residential Group Homes Inc | $252,700 | |
| Previous Owner | Alemi Esmail | $152,000 |
Source: Public Records
Tax History Compared to Growth
Tax History
| Year | Tax Paid | Tax Assessment Tax Assessment Total Assessment is a certain percentage of the fair market value that is determined by local assessors to be the total taxable value of land and additions on the property. | Land | Improvement |
|---|---|---|---|---|
| 2025 | $7,786 | $503,404 | $377,557 | $125,847 |
| 2024 | $7,786 | $493,534 | $370,154 | $123,380 |
| 2023 | $7,695 | $483,858 | $362,897 | $120,961 |
| 2022 | $7,554 | $474,372 | $355,782 | $118,590 |
| 2021 | $7,367 | $465,071 | $348,806 | $116,265 |
| 2020 | $7,028 | $460,303 | $345,230 | $115,073 |
| 2019 | $6,921 | $451,278 | $338,461 | $112,817 |
| 2018 | $6,730 | $442,430 | $331,825 | $110,605 |
| 2017 | $6,565 | $433,756 | $325,319 | $108,437 |
| 2016 | $6,258 | $425,252 | $318,941 | $106,311 |
| 2015 | $6,179 | $418,866 | $314,151 | $104,715 |
| 2014 | $5,618 | $410,662 | $307,998 | $102,664 |
Source: Public Records
Map
Nearby Homes
- 1921 Camden Ave
- 3429 New Jersey Ave
- 14361 Lenray Ln
- 3335 Jennifer Way
- 3328 Kimber Ct Unit 21
- 14570 Wyrick Ave
- 1505 Love Ct
- 1507 Love Ct
- 1502 Love Ct
- 1501 Paradise Ct
- 1500 Paradise Ct
- 2925 Newark Way
- 2088 Cully Place
- 1503 Love Ct
- 1799 Bradford Way
- 1800 Donna Ln
- 2896 Union Ave
- 1828 Nestorita Way
- 14802 Cole Dr
- 2985 Lantz Ave
- 1933 Camden Ave
- 1925 Camden Ave
- 1928 Bernice Way
- 1926 Bernice Way
- 1932 Bernice Way
- 1935 Camden Ave
- 1923 Camden Ave
- 1924 Bernice Way
- 1938 Bernice Way
- 39073909 Camden Ave
- 1939 Camden Ave
- 1930 Camden Ave
- 1942 Bernice Way
- 1941 Camden Ave
- 3510 Hilary Dr
- 1933 Bernice Way
- 1936 Camden Ave
- 1937 Bernice Way
- 14710 Camden Ave
- 3495 New Jersey Ave