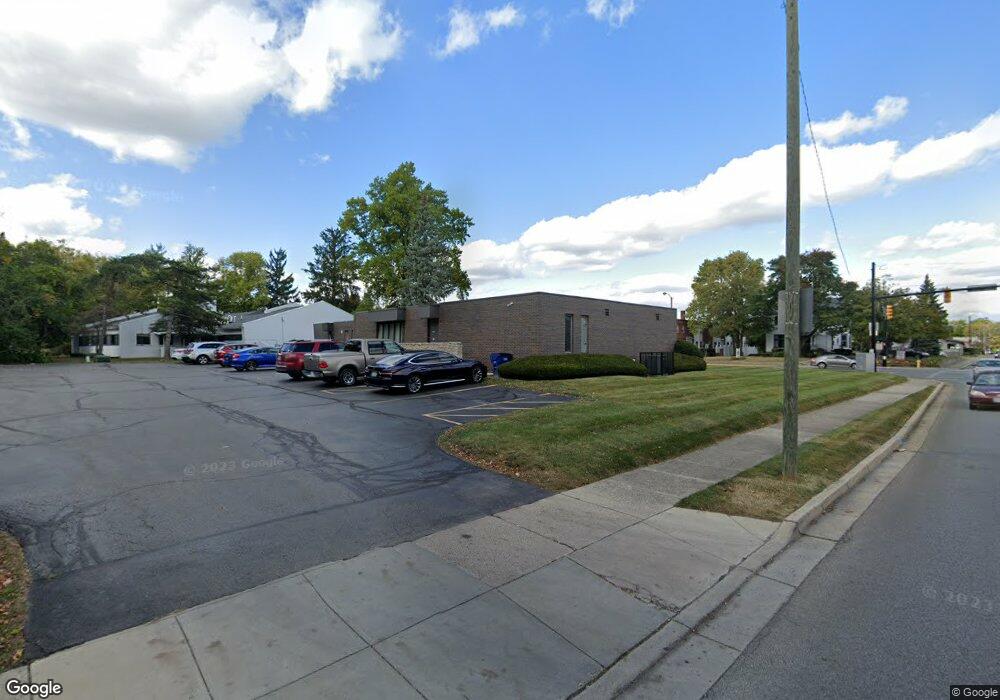
1929 E High St Springfield, OH 45505
Estimated Value: $353,252
Studio
--
Bath
2,365
Sq Ft
$149/Sq Ft
Est. Value
About This Home
This home is located at 1929 E High St, Springfield, OH 45505 and is currently estimated at $353,252, approximately $149 per square foot. 1929 E High St is a home located in Clark County with nearby schools including Mann Elementary School, Schaefer Middle School, and Springfield High School.
Ownership History
Date
Name
Owned For
Owner Type
Purchase Details
Closed on
Aug 23, 2024
Sold by
Imagine Ventures Ii Llc
Bought by
Cincinnati Capital Partners 610 Llc
Current Estimated Value
Home Financials for this Owner
Home Financials are based on the most recent Mortgage that was taken out on this home.
Original Mortgage
$230,000
Outstanding Balance
$222,524
Interest Rate
6.89%
Mortgage Type
New Conventional
Estimated Equity
$130,728
Purchase Details
Closed on
Jun 22, 2010
Sold by
Garg Management Group Ltd
Bought by
Drd Holdings Llc
Purchase Details
Closed on
Apr 15, 2002
Sold by
Garg Anup K and Garg Anup
Bought by
Garg Management Group Ltd
Purchase Details
Closed on
Oct 3, 1996
Sold by
Sebastian Richard C
Bought by
Garg Anup K
Home Financials for this Owner
Home Financials are based on the most recent Mortgage that was taken out on this home.
Original Mortgage
$160,000
Interest Rate
8%
Mortgage Type
Commercial
Create a Home Valuation Report for This Property
The Home Valuation Report is an in-depth analysis detailing your home's value as well as a comparison with similar homes in the area
Home Values in the Area
Average Home Value in this Area
Purchase History
| Date | Buyer | Sale Price | Title Company |
|---|---|---|---|
| Cincinnati Capital Partners 610 Llc | $340,000 | None Listed On Document | |
| Drd Holdings Llc | -- | Cuyahoga Title Services | |
| Garg Management Group Ltd | -- | -- | |
| Garg Anup K | $200,000 | -- |
Source: Public Records
Mortgage History
| Date | Status | Borrower | Loan Amount |
|---|---|---|---|
| Open | Cincinnati Capital Partners 610 Llc | $230,000 | |
| Previous Owner | Garg Anup K | $160,000 |
Source: Public Records
Tax History
| Year | Tax Paid | Tax Assessment Tax Assessment Total Assessment is a certain percentage of the fair market value that is determined by local assessors to be the total taxable value of land and additions on the property. | Land | Improvement |
|---|---|---|---|---|
| 2025 | $8,531 | $91,850 | $14,940 | $76,910 |
| 2024 | $5,443 | $75,010 | $10,670 | $64,340 |
| 2023 | $5,443 | $75,010 | $10,670 | $64,340 |
| 2022 | $5,536 | $75,010 | $10,670 | $64,340 |
| 2021 | $5,479 | $75,010 | $10,670 | $64,340 |
| 2020 | $5,478 | $75,010 | $10,670 | $64,340 |
| 2019 | $5,493 | $75,010 | $10,670 | $64,340 |
| 2018 | $6,062 | $82,590 | $10,670 | $71,920 |
| 2017 | $6,101 | $82,594 | $10,672 | $71,922 |
| 2016 | $6,070 | $82,594 | $10,672 | $71,922 |
| 2015 | $6,142 | $82,594 | $10,672 | $71,922 |
| 2014 | $6,074 | $82,594 | $10,672 | $71,922 |
| 2013 | $2,969 | $82,594 | $10,672 | $71,922 |
Source: Public Records
Map
Nearby Homes
- 250 S Douglas Ave Unit 254
- 2111 Kenilworth Ave
- 273 S Clairmont Ave
- 1707 Highland Ave
- 1703 Highland Ave
- 400 S Arlington Ave Unit 402
- 1569-1571 Mound St
- 1701 Lexington Ave
- 1664 Warder St
- 2425 Kenilworth Ave
- 1621 Morgan St
- 2424-2426 E High St
- 1721 Prospect St
- 1609 Irwin Ave
- 321 Glenn Ave
- 374 Raffensperger Ave
- 1570 Morgan St
- 360 S Greenmount Ave
- 360 Buxton Ave
- 1602 Prospect St
- 202 S Belmont Ave
- 228 S Belmont Ave
- 233 S Belmont Ave
- 1920 E High St
- 234 S Hubert Ave
- 2021 E High St
- 1910 E High St
- 253 S Belmont Ave
- 252 S Belmont Ave
- 225 S Douglas Ave
- 233 S Douglas Ave
- 101 S Belmont Ave
- 263 S Belmont Ave
- 246 S Hubert Ave
- 266 S Belmont Ave
- 248 S Hubert Ave
- 253 S Douglas Ave
- 273 S Belmont Ave
- 257 S Douglas Ave
- 270 S Belmont Ave
Your Personal Tour Guide
Ask me questions while you tour the home.