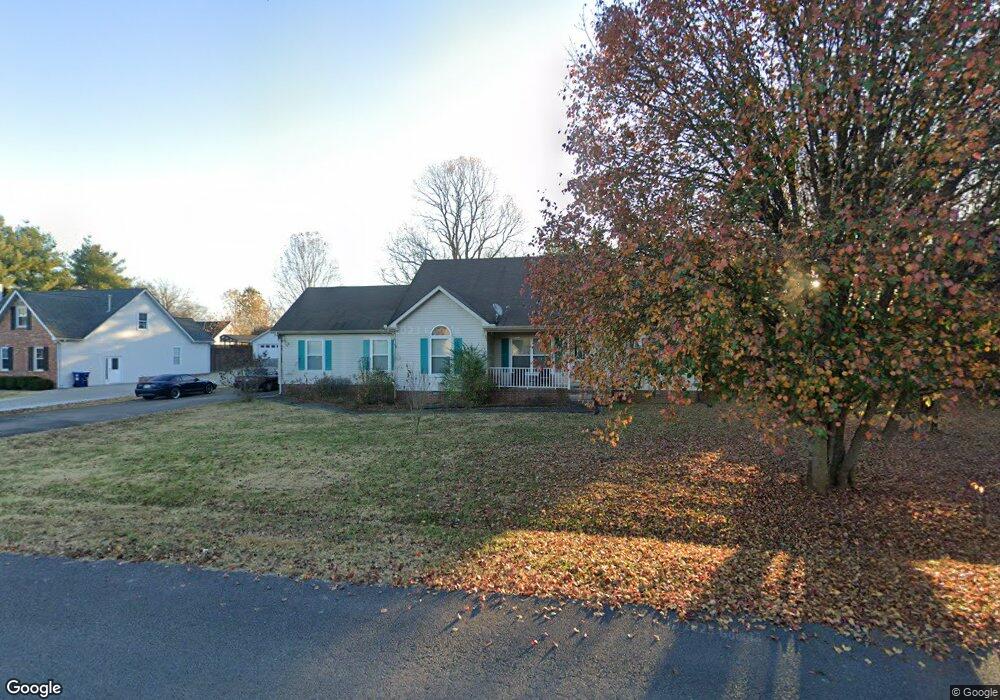
1929 Sterling St Murfreesboro, TN 37127
Estimated Value: $342,000 - $388,000
3
Beds
2
Baths
1,639
Sq Ft
$224/Sq Ft
Est. Value
About This Home
This home is located at 1929 Sterling St, Murfreesboro, TN 37127 and is currently estimated at $367,824, approximately $224 per square foot. 1929 Sterling St is a home located in Rutherford County with nearby schools including Buchanan Elementary School, Whitworth-Buchanan Middle School, and Riverdale High School.
Ownership History
Date
Name
Owned For
Owner Type
Purchase Details
Closed on
Mar 13, 2017
Sold by
Stwartz Arthur W
Bought by
Heathington Darryl and Heathington Kayla
Current Estimated Value
Home Financials for this Owner
Home Financials are based on the most recent Mortgage that was taken out on this home.
Original Mortgage
$204,300
Outstanding Balance
$167,878
Interest Rate
4.19%
Mortgage Type
VA
Estimated Equity
$199,946
Purchase Details
Closed on
Jul 24, 2007
Sold by
Mcintosh Adam L
Bought by
Stewart Arthur W
Home Financials for this Owner
Home Financials are based on the most recent Mortgage that was taken out on this home.
Original Mortgage
$148,538
Interest Rate
6.63%
Mortgage Type
Purchase Money Mortgage
Purchase Details
Closed on
May 9, 2003
Sold by
Jeffery Tomasiewski
Bought by
Mcintosh Adam L
Home Financials for this Owner
Home Financials are based on the most recent Mortgage that was taken out on this home.
Original Mortgage
$110,761
Interest Rate
5.76%
Purchase Details
Closed on
Jun 6, 2000
Sold by
Davis Dennis L
Bought by
Tomaszewski Jeffrey D
Purchase Details
Closed on
Nov 18, 1994
Sold by
Joe Wall
Bought by
Davis Dennis L
Purchase Details
Closed on
Aug 10, 1994
Sold by
O'brien James M
Bought by
Joe Wall
Create a Home Valuation Report for This Property
The Home Valuation Report is an in-depth analysis detailing your home's value as well as a comparison with similar homes in the area
Home Values in the Area
Average Home Value in this Area
Purchase History
| Date | Buyer | Sale Price | Title Company |
|---|---|---|---|
| Heathington Darryl | $200,000 | Realty Title & Escrow Co Inc | |
| Stewart Arthur W | $150,870 | -- | |
| Mcintosh Adam L | $112,500 | -- | |
| Tomaszewski Jeffrey D | $109,000 | -- | |
| Davis Dennis L | $97,900 | -- | |
| Joe Wall | -- | -- |
Source: Public Records
Mortgage History
| Date | Status | Borrower | Loan Amount |
|---|---|---|---|
| Open | Heathington Darryl | $204,300 | |
| Previous Owner | Joe Wall | $148,538 | |
| Previous Owner | Joe Wall | $110,761 |
Source: Public Records
Tax History
| Year | Tax Paid | Tax Assessment Tax Assessment Total Assessment is a certain percentage of the fair market value that is determined by local assessors to be the total taxable value of land and additions on the property. | Land | Improvement |
|---|---|---|---|---|
| 2025 | $1,296 | $69,075 | $13,750 | $55,325 |
| 2024 | $1,296 | $69,075 | $13,750 | $55,325 |
| 2023 | $1,296 | $69,075 | $13,750 | $55,325 |
| 2022 | $1,116 | $69,075 | $13,750 | $55,325 |
| 2021 | $1,104 | $49,725 | $10,000 | $39,725 |
| 2020 | $1,104 | $49,725 | $10,000 | $39,725 |
| 2019 | $1,104 | $49,725 | $10,000 | $39,725 |
| 2018 | $1,044 | $49,725 | $0 | $0 |
| 2017 | $868 | $32,375 | $0 | $0 |
| 2016 | $868 | $32,375 | $0 | $0 |
| 2015 | $868 | $32,375 | $0 | $0 |
| 2014 | $805 | $32,375 | $0 | $0 |
| 2013 | -- | $31,225 | $0 | $0 |
Source: Public Records
Map
Nearby Homes
- 2039 Sterling St
- 120 Oak Knoll Ct
- 1522 Goblet Dr
- 2212 Pickwick Place
- 1526 Goblet Dr
- 2216 Pickwick Place
- 3505 Quintana Dr
- 3435 Quintana Dr
- 2210 Cancellara Ct
- 3266 Bradyville Pike
- 3260 Bradyville Pike
- 1602 Amapola Ln
- 2628 Galahad Dr
- 1722 Garnet Way
- 1714 Garnet Way
- 4282 Lytle Creek Dr
- 1710 Garnet Way
- 3128 Citrine Dr
- 3124 Citrine Dr
- 3120 Citrine Dr
- 1933 Sterling St
- 1925 Sterling St
- 128 Cool Springs Dr
- 124 Cool Springs Dr
- 132 Cool Springs Dr
- 1939 Sterling St
- 1932 Sterling St
- 1928 Sterling St
- 1921 Sterling St
- 1936 Sterling St
- 120 Cool Springs Dr
- 1924 Sterling St
- 136 Cool Springs Dr
- 1940 Sterling St
- 1920 Sterling St
- 140 Cool Springs Dr
- 2001 Sterling St
- 114 Cool Springs Dr
- 129 Cool Springs Dr
- 2003 Marlow Ave
Your Personal Tour Guide
Ask me questions while you tour the home.