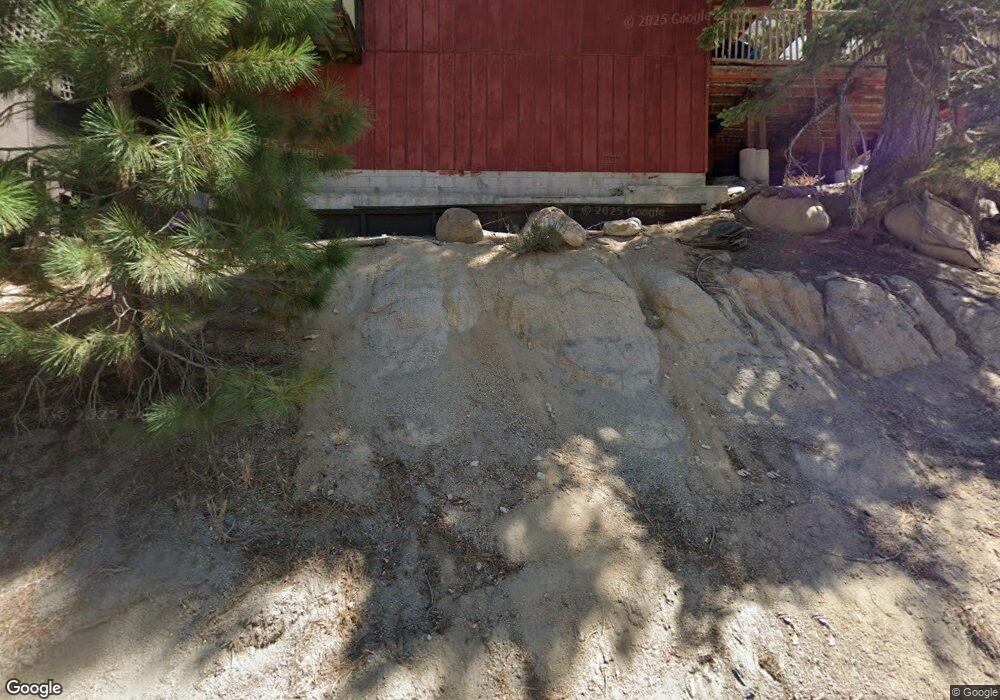
193 Tramway Dr Unit A Stateline, NV 89449
Estimated Value: $425,000 - $537,000
1
Bed
1
Bath
912
Sq Ft
$502/Sq Ft
Est. Value
About This Home
This home is located at 193 Tramway Dr Unit A, Stateline, NV 89449 and is currently estimated at $458,151, approximately $502 per square foot. 193 Tramway Dr Unit A is a home located in Douglas County with nearby schools including Jacks Valley Elementary School, Carson Valley Middle School, and Douglas County High School.
Ownership History
Date
Name
Owned For
Owner Type
Purchase Details
Closed on
Jan 23, 2008
Sold by
Tragert Erin and Cathers Erin
Bought by
Mahrle Scott R and Bauguess Kathleen A
Current Estimated Value
Home Financials for this Owner
Home Financials are based on the most recent Mortgage that was taken out on this home.
Original Mortgage
$283,500
Outstanding Balance
$176,601
Interest Rate
6.17%
Mortgage Type
Unknown
Estimated Equity
$281,550
Purchase Details
Closed on
Jul 1, 2005
Sold by
Cruse John E
Bought by
Cathers Erin
Home Financials for this Owner
Home Financials are based on the most recent Mortgage that was taken out on this home.
Original Mortgage
$195,200
Interest Rate
6.5%
Mortgage Type
Adjustable Rate Mortgage/ARM
Create a Home Valuation Report for This Property
The Home Valuation Report is an in-depth analysis detailing your home's value as well as a comparison with similar homes in the area
Home Values in the Area
Average Home Value in this Area
Purchase History
| Date | Buyer | Sale Price | Title Company |
|---|---|---|---|
| Mahrle Scott R | $315,000 | First American Title Ren | |
| Tragert Erin | -- | First American Title Reno | |
| Cathers Erin | $244,000 | Stewart Title Of Douglas |
Source: Public Records
Mortgage History
| Date | Status | Borrower | Loan Amount |
|---|---|---|---|
| Open | Mahrle Scott R | $283,500 | |
| Previous Owner | Cathers Erin | $195,200 |
Source: Public Records
Tax History
| Year | Tax Paid | Tax Assessment Tax Assessment Total Assessment is a certain percentage of the fair market value that is determined by local assessors to be the total taxable value of land and additions on the property. | Land | Improvement |
|---|---|---|---|---|
| 2026 | $1,479 | $63,960 | $47,250 | $16,710 |
| 2025 | $1,397 | $64,632 | $47,250 | $17,382 |
| 2024 | $1,397 | $65,625 | $47,250 | $18,375 |
| 2023 | $1,308 | $63,932 | $47,250 | $16,682 |
| 2022 | $1,199 | $60,088 | $43,750 | $16,338 |
| 2021 | $1,111 | $56,199 | $40,250 | $15,949 |
| 2020 | $1,075 | $56,280 | $40,250 | $16,030 |
| 2019 | $1,037 | $52,454 | $36,575 | $15,879 |
| 2018 | $1,639 | $49,141 | $33,250 | $15,891 |
| 2017 | $926 | $49,431 | $33,250 | $16,181 |
| 2016 | $926 | $39,097 | $22,750 | $16,347 |
| 2015 | $920 | $39,097 | $22,750 | $16,347 |
| 2014 | $891 | $36,508 | $21,000 | $15,508 |
Source: Public Records
Map
Nearby Homes
- 179 Tramway Dr Unit B
- 179 Tramway Dr Unit A
- 753 Bigler Cir
- 146 Tramway Dr
- 716 Tina Ct
- 187 Tramway Dr
- 183 Tramway Dr
- 195 Tramway Dr
- 189 Tramway Dr
- 219 S Benjamin Dr Unit B
- 111 Tramway Dr Unit 5
- 754 Boulder Ct Unit 2
- 710 Tina Ct Unit B-2
- 255 Tramway Dr Unit 1-B
- 227 S Benjamin Dr Unit B
- 759 Boulder Ct Unit A
- 259 Tramway Dr Unit 4
- 259 Tramway Dr Unit 3
- 767 Little Dipper Ct Unit C
- 722 Gary Ln
- 193 Tramway Dr
- 193 Tramway Dr Unit b
- 191ab Tramway
- 191 Tramway Dr Unit A&B
- 191ab Tramway Unit a&b
- 185 Tramway Dr
- 179 Tramway Dr Unit A/B
- 177 Tramway Dr
- 177 Tramway Dr Unit B
- 177 Tramway Dr Unit A
- 175 Tramway Dr
- 175 Tramway Dr Unit A
- 175 Tramway Dr Unit B
- 181 Tramway Dr
- 181 Tramway Dr Unit b
- 181 Tramway Dr Unit A
- 736 Bonnie Ct
- 167 Tramway Dr
- 167 Tramway Dr Unit B
- 165 Tramway Dr
Your Personal Tour Guide
Ask me questions while you tour the home.