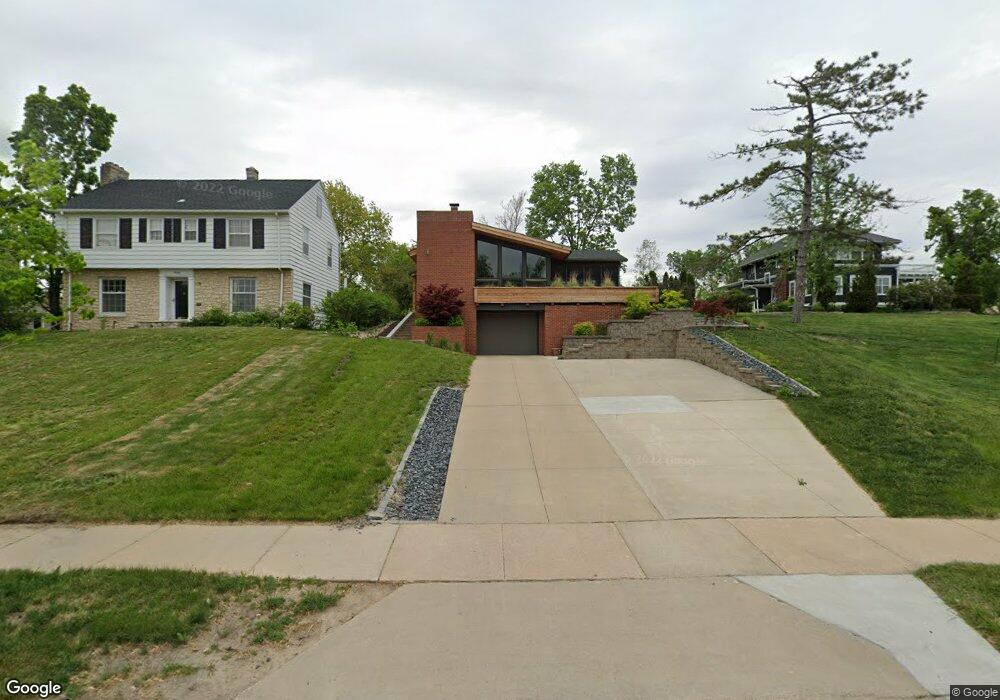
1930 Blake Blvd SE Cedar Rapids, IA 52403
Bever Park NeighborhoodEstimated Value: $190,000 - $312,000
2
Beds
2
Baths
1,707
Sq Ft
$144/Sq Ft
Est. Value
About This Home
This home is located at 1930 Blake Blvd SE, Cedar Rapids, IA 52403 and is currently estimated at $246,012, approximately $144 per square foot. 1930 Blake Blvd SE is a home located in Linn County with nearby schools including Johnson STEAM Academy, McKinley STEAM Academy, and George Washington High School.
Ownership History
Date
Name
Owned For
Owner Type
Purchase Details
Closed on
Dec 15, 2016
Sold by
Christensen Darlene
Bought by
Odonnell Stephen B and Odonnell Elizabeth A
Current Estimated Value
Purchase Details
Closed on
Jun 15, 2012
Sold by
Crpm Llc
Bought by
Christensen Darlene
Home Financials for this Owner
Home Financials are based on the most recent Mortgage that was taken out on this home.
Original Mortgage
$85,000
Interest Rate
3.83%
Mortgage Type
New Conventional
Purchase Details
Closed on
Jul 19, 2011
Sold by
Huston Betsy
Bought by
Crpm Llc
Home Financials for this Owner
Home Financials are based on the most recent Mortgage that was taken out on this home.
Original Mortgage
$130,000
Interest Rate
4.52%
Mortgage Type
Future Advance Clause Open End Mortgage
Create a Home Valuation Report for This Property
The Home Valuation Report is an in-depth analysis detailing your home's value as well as a comparison with similar homes in the area
Home Values in the Area
Average Home Value in this Area
Purchase History
| Date | Buyer | Sale Price | Title Company |
|---|---|---|---|
| Odonnell Stephen B | -- | None Available | |
| Christensen Darlene | $160,000 | None Available | |
| Crpm Llc | $92,000 | None Available |
Source: Public Records
Mortgage History
| Date | Status | Borrower | Loan Amount |
|---|---|---|---|
| Previous Owner | Christensen Darlene | $85,000 | |
| Previous Owner | Crpm Llc | $130,000 |
Source: Public Records
Tax History
| Year | Tax Paid | Tax Assessment Tax Assessment Total Assessment is a certain percentage of the fair market value that is determined by local assessors to be the total taxable value of land and additions on the property. | Land | Improvement |
|---|---|---|---|---|
| 2025 | $3,894 | $241,900 | $54,600 | $187,300 |
| 2024 | $3,614 | $220,000 | $48,200 | $171,800 |
| 2023 | $3,614 | $220,000 | $48,200 | $171,800 |
| 2022 | $3,578 | $171,300 | $44,900 | $126,400 |
| 2021 | $4,048 | $172,700 | $44,900 | $127,800 |
| 2020 | $4,048 | $183,500 | $44,900 | $138,600 |
| 2019 | $3,806 | $176,600 | $32,100 | $144,500 |
Source: Public Records
Map
Nearby Homes
- 2009 Blake Blvd SE
- 1906 Park Ave SE
- 1900 Park Ave SE
- 2039 Park Ave SE
- 2005 Washington Ave SE
- 1704 Park Ave SE
- 1720 2nd Ave SE
- 371 19th St SE
- 1953 1st Ave SE Unit 301
- 1953 1st Ave SE Unit 503
- 1953 1st Ave NE Unit 301
- 1703 A Ave NE
- 202 Forest Dr SE
- 1741 4th Ave SE
- 8821 Zeppelin Ave NE
- 122 20th St NE
- 198 Forest Dr SE
- 2241 Linden Dr SE
- 1800 5th Ave SE
- 1740 5th Ave SE
- 1926 Blake Blvd SE
- 327 Nassau St SE
- 321 Nassau St SE
- 1912 Blake Blvd SE
- 1935 Blake Blvd SE
- 1929 Blake Blvd SE
- 1941 Blake Blvd SE
- 1925 Blake Blvd SE
- 328 19th St SE
- 1921 Blake Blvd SE
- 1947 Blake Blvd SE
- 320 19th St SE
- 1900 Blake Blvd SE
- 1953 Blake Blvd SE
- 1915 Blake Blvd SE
- 318 19th St SE
- 315 Nassau St SE
- 2000 Blake Blvd SE
- 1909 Blake Blvd SE
- 1955 Blake Blvd SE
Your Personal Tour Guide
Ask me questions while you tour the home.