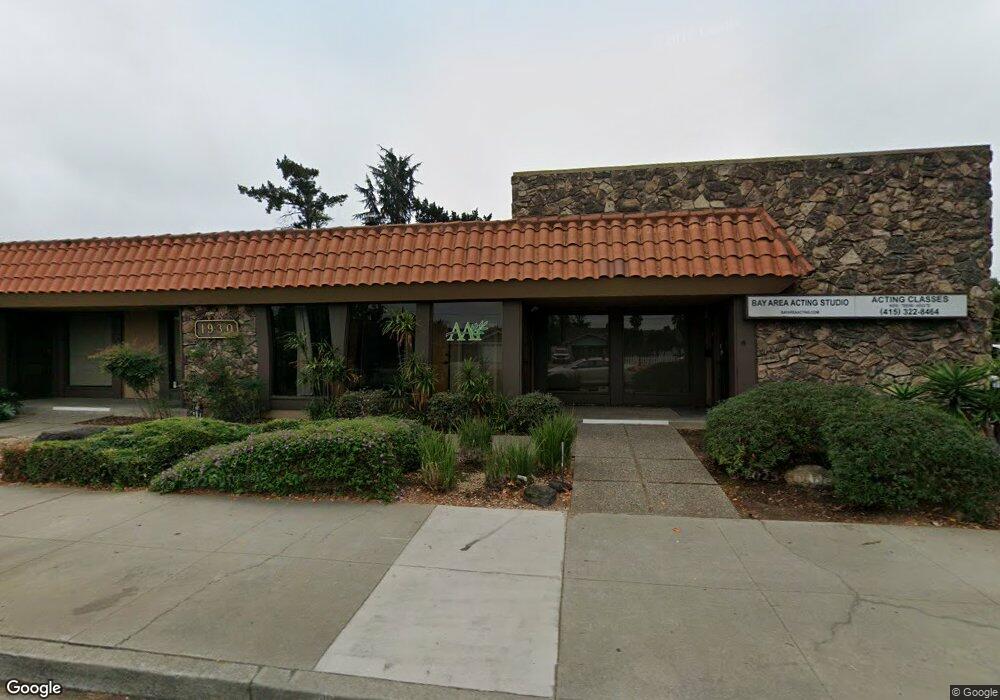
1930 Camden Ave San Jose, CA 95124
Cambrian Neighborhood
--
Bed
--
Bath
10,716
Sq Ft
0.36
Acres
About This Home
This home is located at 1930 Camden Ave, San Jose, CA 95124. 1930 Camden Ave is a home located in Santa Clara County with nearby schools including Leigh High School, Farnham Elementary School, and Sartorette Charter School.
Ownership History
Date
Name
Owned For
Owner Type
Purchase Details
Closed on
Jul 15, 2025
Sold by
Crisafulli Santa
Bought by
Sam And Sandy Crisafulli Family Trust and Crisafulli
Purchase Details
Closed on
Feb 2, 2021
Sold by
Consentino 1995 Trust
Bought by
Consentino Kristi A and Hershey Robin L
Purchase Details
Closed on
Dec 23, 2010
Sold by
Consentino Paul W
Bought by
Consentino Paul W
Purchase Details
Closed on
Feb 6, 2008
Sold by
Lamantia Larry S
Bought by
Lamantia Larry S
Purchase Details
Closed on
Dec 28, 2000
Sold by
Consentino Paul W
Bought by
Consentino Paul W
Purchase Details
Closed on
Jul 7, 2000
Sold by
Lamantia Mae E
Bought by
Lamantia Mae E
Purchase Details
Closed on
Sep 20, 1995
Sold by
Consentino Paul W and Consentino Karen E
Bought by
Consentino Paul W and Consentino Karen E
Create a Home Valuation Report for This Property
The Home Valuation Report is an in-depth analysis detailing your home's value as well as a comparison with similar homes in the area
Home Values in the Area
Average Home Value in this Area
Purchase History
| Date | Buyer | Sale Price | Title Company |
|---|---|---|---|
| Sam And Sandy Crisafulli Family Trust | -- | None Listed On Document | |
| Consentino Kristi A | -- | Gendotti Diana | |
| Consentino Kristi A | -- | None Available | |
| Consentino Gregg S | -- | None Available | |
| Consentino Paul W | -- | Accommodation | |
| Crisafulli Santa | -- | Accommodation | |
| Lamantia Larry S | -- | None Available | |
| Lamantia Larry S | -- | None Available | |
| Lamantia Larry S | -- | None Available | |
| Consentino Paul W | -- | -- | |
| Lamantia Mae E | -- | -- | |
| Consentino Paul W | -- | -- | |
| Consentino Paul W | -- | -- | |
| Consentino Paul W | -- | -- | |
| Consentino Paul W | -- | -- | |
| Consentino Paul W | -- | -- | |
| Consentino Paul W | -- | -- |
Source: Public Records
Tax History Compared to Growth
Tax History
| Year | Tax Paid | Tax Assessment Tax Assessment Total Assessment is a certain percentage of the fair market value that is determined by local assessors to be the total taxable value of land and additions on the property. | Land | Improvement |
|---|---|---|---|---|
| 2025 | $6,059 | $374,693 | $127,273 | $247,420 |
| 2024 | $6,059 | $367,347 | $124,778 | $242,569 |
| 2023 | $6,583 | $360,145 | $122,332 | $237,813 |
| 2022 | $5,983 | $353,084 | $119,934 | $233,150 |
| 2021 | $5,758 | $346,162 | $117,583 | $228,579 |
| 2020 | $5,771 | $342,614 | $116,378 | $226,236 |
| 2019 | $5,750 | $335,897 | $114,097 | $221,800 |
| 2018 | $6,072 | $329,311 | $111,860 | $217,451 |
| 2017 | $5,409 | $322,855 | $109,667 | $213,188 |
| 2016 | $5,478 | $316,525 | $107,517 | $209,008 |
| 2015 | $5,796 | $311,771 | $105,902 | $205,869 |
| 2014 | $5,262 | $305,665 | $103,828 | $201,837 |
Source: Public Records
Map
Nearby Homes
- 1921 Camden Ave
- 14361 Lenray Ln
- 3429 New Jersey Ave
- 3335 Jennifer Way
- 3328 Kimber Ct Unit 21
- 14570 Wyrick Ave
- 1505 Love Ct
- 1507 Love Ct
- 1502 Love Ct
- 1501 Paradise Ct
- 1500 Paradise Ct
- 1503 Love Ct
- 1799 Bradford Way
- 1800 Donna Ln
- 2925 Newark Way
- 2088 Cully Place
- 14802 Cole Dr
- 1828 Nestorita Way
- 2896 Union Ave
- 4216 Camden Ave
- 1936 Camden Ave
- 39073909 Camden Ave
- 14710 Camden Ave
- 14704 Camden Ave
- 14281 New Jersey Ave
- 14291 New Jersey Ave
- 14700 Camden Ave
- 14301 New Jersey Ave
- 1929 Camden Ave
- 1925 Camden Ave
- 1933 Camden Ave
- 1923 Camden Ave
- 1948 Camden Ave
- 1935 Camden Ave
- 14272 Bercaw Ln
- 1939 Camden Ave
- 14319 New Jersey Ave
- 1928 Bernice Way
- 1926 Bernice Way
- 14288 Bercaw Ln