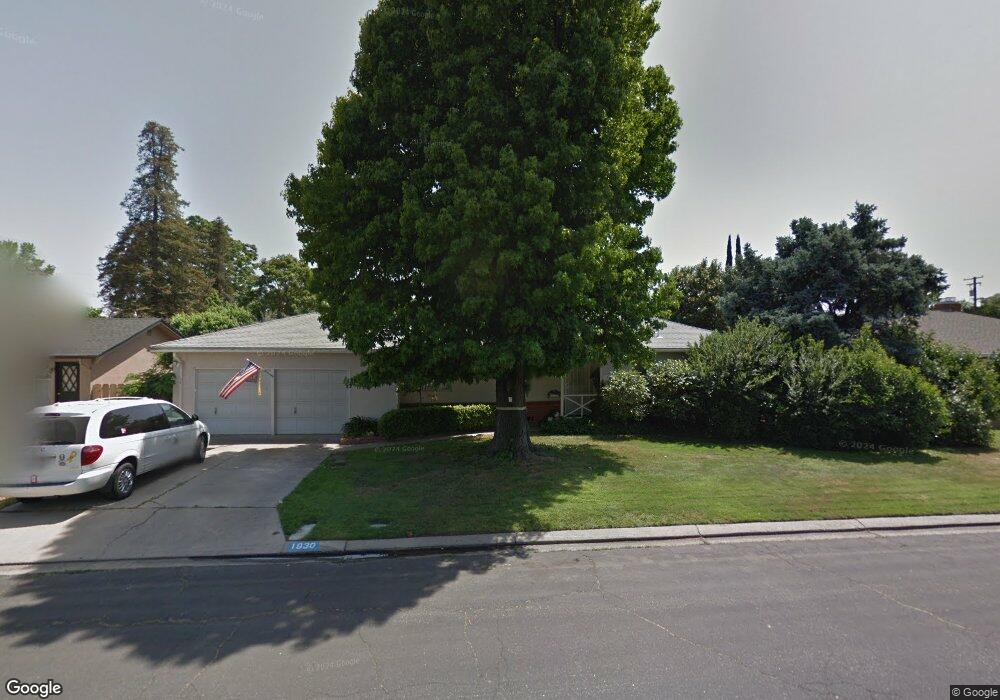
1930 Charles Place Turlock, CA 95380
Estimated Value: $386,000 - $468,000
2
Beds
2
Baths
1,268
Sq Ft
$342/Sq Ft
Est. Value
About This Home
This home is located at 1930 Charles Place, Turlock, CA 95380 and is currently estimated at $434,131, approximately $342 per square foot. 1930 Charles Place is a home located in Stanislaus County with nearby schools including Julien Elementary School, Marvin A. Dutcher Middle School, and Turlock Junior High School.
Ownership History
Date
Name
Owned For
Owner Type
Purchase Details
Closed on
Feb 18, 2025
Sold by
Hutchinson Scott A
Bought by
Scott A Hutchinson 2024 Revocable Trust and Hutchinson
Current Estimated Value
Purchase Details
Closed on
Apr 16, 2024
Sold by
Hutchinson Scott A
Bought by
Scott A Hutchinson 2024 Revocable Trust and Hutchinson
Purchase Details
Closed on
Oct 23, 2009
Sold by
Hutchinson Scott A and Hutchinson Charlotte Silva
Bought by
Hutchinson Scott A and Hutchinson Charlotte Silva
Purchase Details
Closed on
Sep 5, 1995
Sold by
Libby Mark R
Bought by
Hutchinson Scott A and Hutchinson Charlotte S
Home Financials for this Owner
Home Financials are based on the most recent Mortgage that was taken out on this home.
Original Mortgage
$112,000
Interest Rate
7.83%
Create a Home Valuation Report for This Property
The Home Valuation Report is an in-depth analysis detailing your home's value as well as a comparison with similar homes in the area
Home Values in the Area
Average Home Value in this Area
Purchase History
| Date | Buyer | Sale Price | Title Company |
|---|---|---|---|
| Scott A Hutchinson 2024 Revocable Trust | -- | None Listed On Document | |
| Scott A Hutchinson 2024 Revocable Trust | -- | None Listed On Document | |
| Hutchinson Scott A | -- | None Available | |
| Hutchinson Scott A | $140,000 | Chicago Title Co |
Source: Public Records
Mortgage History
| Date | Status | Borrower | Loan Amount |
|---|---|---|---|
| Previous Owner | Hutchinson Scott A | $112,000 |
Source: Public Records
Tax History Compared to Growth
Tax History
| Year | Tax Paid | Tax Assessment Tax Assessment Total Assessment is a certain percentage of the fair market value that is determined by local assessors to be the total taxable value of land and additions on the property. | Land | Improvement |
|---|---|---|---|---|
| 2025 | $3,469 | $330,298 | $138,227 | $192,071 |
| 2024 | $2,375 | $227,998 | $73,282 | $154,716 |
| 2023 | $2,370 | $223,529 | $71,846 | $151,683 |
| 2022 | $2,339 | $219,147 | $70,438 | $148,709 |
| 2021 | $2,303 | $214,851 | $69,057 | $145,794 |
| 2020 | $2,286 | $212,649 | $68,349 | $144,300 |
| 2019 | $2,246 | $208,480 | $67,009 | $141,471 |
| 2018 | $2,243 | $204,394 | $65,696 | $138,698 |
| 2017 | $2,189 | $200,387 | $64,408 | $135,979 |
| 2016 | $2,043 | $196,459 | $63,146 | $133,313 |
| 2015 | $2,024 | $193,509 | $62,198 | $131,311 |
| 2014 | $2,003 | $189,719 | $60,980 | $128,739 |
Source: Public Records
Map
Nearby Homes
- 1990 E Marshall St
- 1509 Sycamore St
- 820 N Berkeley Ave
- 1438 Cahill Ave
- 1598 East Ave
- 2500 E Marshall St
- 2335 E Canal Dr
- 1409 E Marshall St
- 1400 Sycamore St
- 1311 Cahill Ave
- 2521 East Ave
- 658 Oak St
- 2676 Oppelt Way
- 1370 East Ave
- 1015 E Main St
- 951 E Main St
- 274 N Minaret Ave
- 716 N Daubenberger Rd
- 723 E Main St
- 1950 Simon Dr
- 1980 Charles Place
- 1900 Charles Place
- 1998 Charles Place
- 1876 Charles Place
- 1943 E Marshall St
- 1945 E Marshall St
- 431 N Johnson Rd
- 1955 Charles Place
- 1925 Charles Place
- 1895 E Marshall St
- 1975 Charles Place
- 1895 Charles Place
- 1856 Charles Place
- 1995 Charles Place
- 401 N Johnson Rd
- 1875 E Marshall St
- 1875 Charles Place
- 2000 Zinfandel Ln
- 2005 Zinfandel Ln
- 1855 E Marshall St