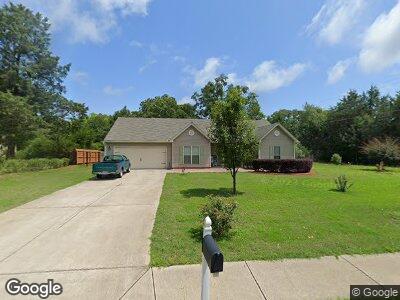
1930 Diamond Ridge Dr Unit 1 Statham, GA 30666
Estimated Value: $307,200 - $354,000
3
Beds
3
Baths
1,711
Sq Ft
$196/Sq Ft
Est. Value
About This Home
This home is located at 1930 Diamond Ridge Dr Unit 1, Statham, GA 30666 and is currently estimated at $334,800, approximately $195 per square foot. 1930 Diamond Ridge Dr Unit 1 is a home located in Barrow County with nearby schools including Statham Elementary School, Bear Creek Middle School, and Winder-Barrow High School.
Ownership History
Date
Name
Owned For
Owner Type
Purchase Details
Closed on
Feb 7, 2017
Sold by
Southfork Homes Llc
Bought by
Rivera Carlos E and Rivera Iris D
Current Estimated Value
Home Financials for this Owner
Home Financials are based on the most recent Mortgage that was taken out on this home.
Original Mortgage
$58,793
Outstanding Balance
$49,153
Interest Rate
4.12%
Mortgage Type
New Conventional
Estimated Equity
$285,647
Purchase Details
Closed on
Jun 17, 2016
Sold by
Haynes Investment Properties Llc
Bought by
Southfork Homes Llc
Purchase Details
Closed on
Apr 24, 2014
Sold by
First American Bank & Trus
Bought by
Haynes Investment Properties L
Purchase Details
Closed on
Apr 6, 2010
Sold by
Diamond Developers Llc
Bought by
First American Bk & Trust
Purchase Details
Closed on
Apr 24, 2006
Sold by
Taylor Bean and Whitaker Mortage
Bought by
Diamond Developers Llc
Create a Home Valuation Report for This Property
The Home Valuation Report is an in-depth analysis detailing your home's value as well as a comparison with similar homes in the area
Home Values in the Area
Average Home Value in this Area
Purchase History
| Date | Buyer | Sale Price | Title Company |
|---|---|---|---|
| Rivera Carlos E | $158,900 | -- | |
| Southfork Homes Llc | $78,000 | -- | |
| Haynes Investment Properties L | $5,610 | -- | |
| First American Bk & Trust | $203,143 | -- | |
| Diamond Developers Llc | -- | -- |
Source: Public Records
Mortgage History
| Date | Status | Borrower | Loan Amount |
|---|---|---|---|
| Open | Rivera Carlos E | $58,793 |
Source: Public Records
Tax History Compared to Growth
Tax History
| Year | Tax Paid | Tax Assessment Tax Assessment Total Assessment is a certain percentage of the fair market value that is determined by local assessors to be the total taxable value of land and additions on the property. | Land | Improvement |
|---|---|---|---|---|
| 2024 | $1,194 | $100,194 | $14,200 | $85,994 |
| 2023 | $1,355 | $100,594 | $14,200 | $86,394 |
| 2022 | $644 | $64,953 | $14,200 | $50,753 |
| 2021 | $682 | $64,953 | $14,200 | $50,753 |
| 2020 | $672 | $64,953 | $14,200 | $50,753 |
| 2019 | $700 | $64,953 | $14,200 | $50,753 |
| 2018 | $645 | $62,750 | $14,200 | $48,550 |
| 2017 | $1,017 | $34,912 | $14,200 | $20,712 |
| 2016 | $323 | $8,520 | $8,520 | $0 |
| 2015 | $71 | $8,520 | $8,520 | $0 |
| 2014 | $188 | $3,877 | $3,877 | $0 |
| 2013 | -- | $3,876 | $3,876 | $0 |
Source: Public Records
Map
Nearby Homes
- 1945 Diamond Ridge Dr
- 0 Georgia 330
- 101 Corey Ct
- 236 Dooly Dr Unit 13
- 1967 Highway 211 NE
- 1630 White Oak Dr
- 3036 Johnson-Hale Rd
- 400 Kinsley Way
- 47 Kinsley Way
- 2025 Emerald Pointe Dr
- 2075 Georgia Highway 211
- 2075 Highway 211 NE
- 3845 S Highway 82
- 170 Kinsley Way
- 90 Jefferson Rd
- 0 Jefferson Rd Unit 10480464
- 0 Jefferson Rd Unit 10471807
- 0 Jefferson Rd Unit 7535283
- 20 Highway 211 SE
- 20 Georgia Highway 211
- 1930 Diamond Ridge Dr
- 1930 Diamond Ridge Dr Unit 1
- 2040 Highway 82
- 1932 Diamond Ridge Dr Unit 2
- 1932 Diamond Ridge Dr
- 1934 Diamond Ridge Dr
- 1936 Diamond Ridge Dr
- 1935 Diamond Ridge Dr
- 1938 Diamond Ridge Dr
- 2048 Highway 82
- 2029 Highway 82
- 1940 Diamond Ridge Dr
- 1940 Diamond Ridge Dr Unit 5
- 1939 Diamond Ridge Dr
- 1942 Diamond Ridge Dr Unit 7
- 1941 Diamond Ridge Dr
- 1944 Diamond Ridge Dr Unit 8
- 2010 Highway 82
- 290 Booth Rd
- 1946 Diamond Ridge Dr Unit 9