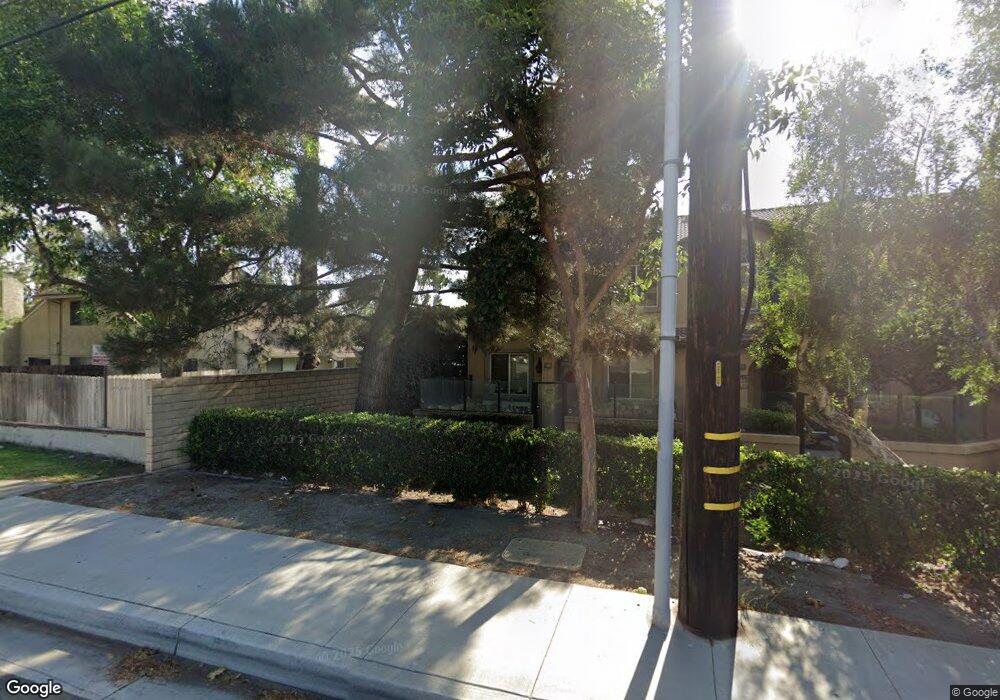
1930 E Yale St Unit 17 Ontario, CA 91764
Estimated Value: $472,000 - $508,000
3
Beds
2
Baths
1,253
Sq Ft
$390/Sq Ft
Est. Value
About This Home
This home is located at 1930 E Yale St Unit 17, Ontario, CA 91764 and is currently estimated at $488,745, approximately $390 per square foot. 1930 E Yale St Unit 17 is a home located in San Bernardino County with nearby schools including Ontario Center School, Rancho Cucamonga Middle, and Colony High.
Ownership History
Date
Name
Owned For
Owner Type
Purchase Details
Closed on
Dec 19, 2020
Sold by
Amaya Rosie and Amaya Rosa A
Bought by
Amaya Rosie and Zazueta Karlo Cesar
Current Estimated Value
Purchase Details
Closed on
Nov 11, 2006
Sold by
Zamora Baltazar V
Bought by
Amaya Rosa A
Purchase Details
Closed on
Mar 26, 1996
Sold by
Muelchi Colleen E
Bought by
Zamora Baltazar V and Amaya Rosa A
Home Financials for this Owner
Home Financials are based on the most recent Mortgage that was taken out on this home.
Original Mortgage
$74,650
Outstanding Balance
$2,540
Interest Rate
7.41%
Mortgage Type
FHA
Estimated Equity
$486,205
Create a Home Valuation Report for This Property
The Home Valuation Report is an in-depth analysis detailing your home's value as well as a comparison with similar homes in the area
Purchase History
| Date | Buyer | Sale Price | Title Company |
|---|---|---|---|
| Amaya Rosie | -- | None Available | |
| Amaya Rosa A | -- | Accommodation | |
| Zamora Baltazar V | $76,500 | Commonwealth Land Title Co |
Source: Public Records
Mortgage History
| Date | Status | Borrower | Loan Amount |
|---|---|---|---|
| Open | Zamora Baltazar V | $74,650 |
Source: Public Records
Tax History
| Year | Tax Paid | Tax Assessment Tax Assessment Total Assessment is a certain percentage of the fair market value that is determined by local assessors to be the total taxable value of land and additions on the property. | Land | Improvement |
|---|---|---|---|---|
| 2025 | $1,360 | $127,091 | $33,228 | $93,863 |
| 2024 | $1,324 | $124,599 | $32,576 | $92,023 |
| 2023 | $1,293 | $122,156 | $31,937 | $90,219 |
| 2022 | $1,270 | $119,761 | $31,311 | $88,450 |
| 2021 | $1,259 | $117,413 | $30,697 | $86,716 |
| 2020 | $1,236 | $116,209 | $30,382 | $85,827 |
| 2019 | $1,230 | $113,930 | $29,786 | $84,144 |
| 2018 | $1,199 | $111,696 | $29,202 | $82,494 |
| 2017 | $1,155 | $109,505 | $28,629 | $80,876 |
| 2016 | $1,140 | $107,358 | $28,068 | $79,290 |
| 2015 | $1,132 | $105,745 | $27,646 | $78,099 |
| 2014 | $1,097 | $103,673 | $27,104 | $76,569 |
Source: Public Records
Map
Nearby Homes
- 1985 E Harvard Privado Unit A
- 1978 E 5th St
- 2072 E Sentinel Privado
- 2076 E Sentinel Privado
- 2139 E 4th St Unit 13
- 2139 E 4th St Unit 79
- 2139 E 4th St Unit 244
- 2139 E 4th St Unit 39
- 2139 E 4th St Unit 84
- 2139 E 4th St #244 St Unit 244
- 1342 N Isadora Way
- 1434 N San Diego Place
- 1908 E Alondra Ct
- 914 N Placer Ave
- 2139 Fourth St
- 1832 Plaza Serena
- 9330 Alderwood Dr
- 1512 E 5th St Unit 70
- 928 N Lake Ave
- 9522 Harvest Vista Dr
- 1930 E Yale St
- 1926 E Yale St Unit A
- 1926 E Yale St Unit B
- 1926 E Yale St
- 1926 E Yale St Unit 8
- 1932 E Yale St Unit A
- 1932 E Yale St
- 1932 E Yale St Unit 20
- 1932 E Yale St Unit B
- 1912 E Yale St Unit A
- 1912 E Yale St Unit 8
- 1912 E Yale St
- 1928 E Yale St
- 1928 E Yale St Unit B
- 1928 E Yale St Unit A
- 1928 E Yale St Unit 21
- 1945 E Harvard Privado Unit B
- 1945 E Harvard Privado Unit A
- 1945 E Harvard Privado Unit C
- 1908 E Yale St Unit A
Your Personal Tour Guide
Ask me questions while you tour the home.